
Capability Analysis
Managing diverse capabilities across multi-functional teams can be a challenge. It’s even more difficult if you inherit a large team and there’s no skills documentation or technology strategy to align to.
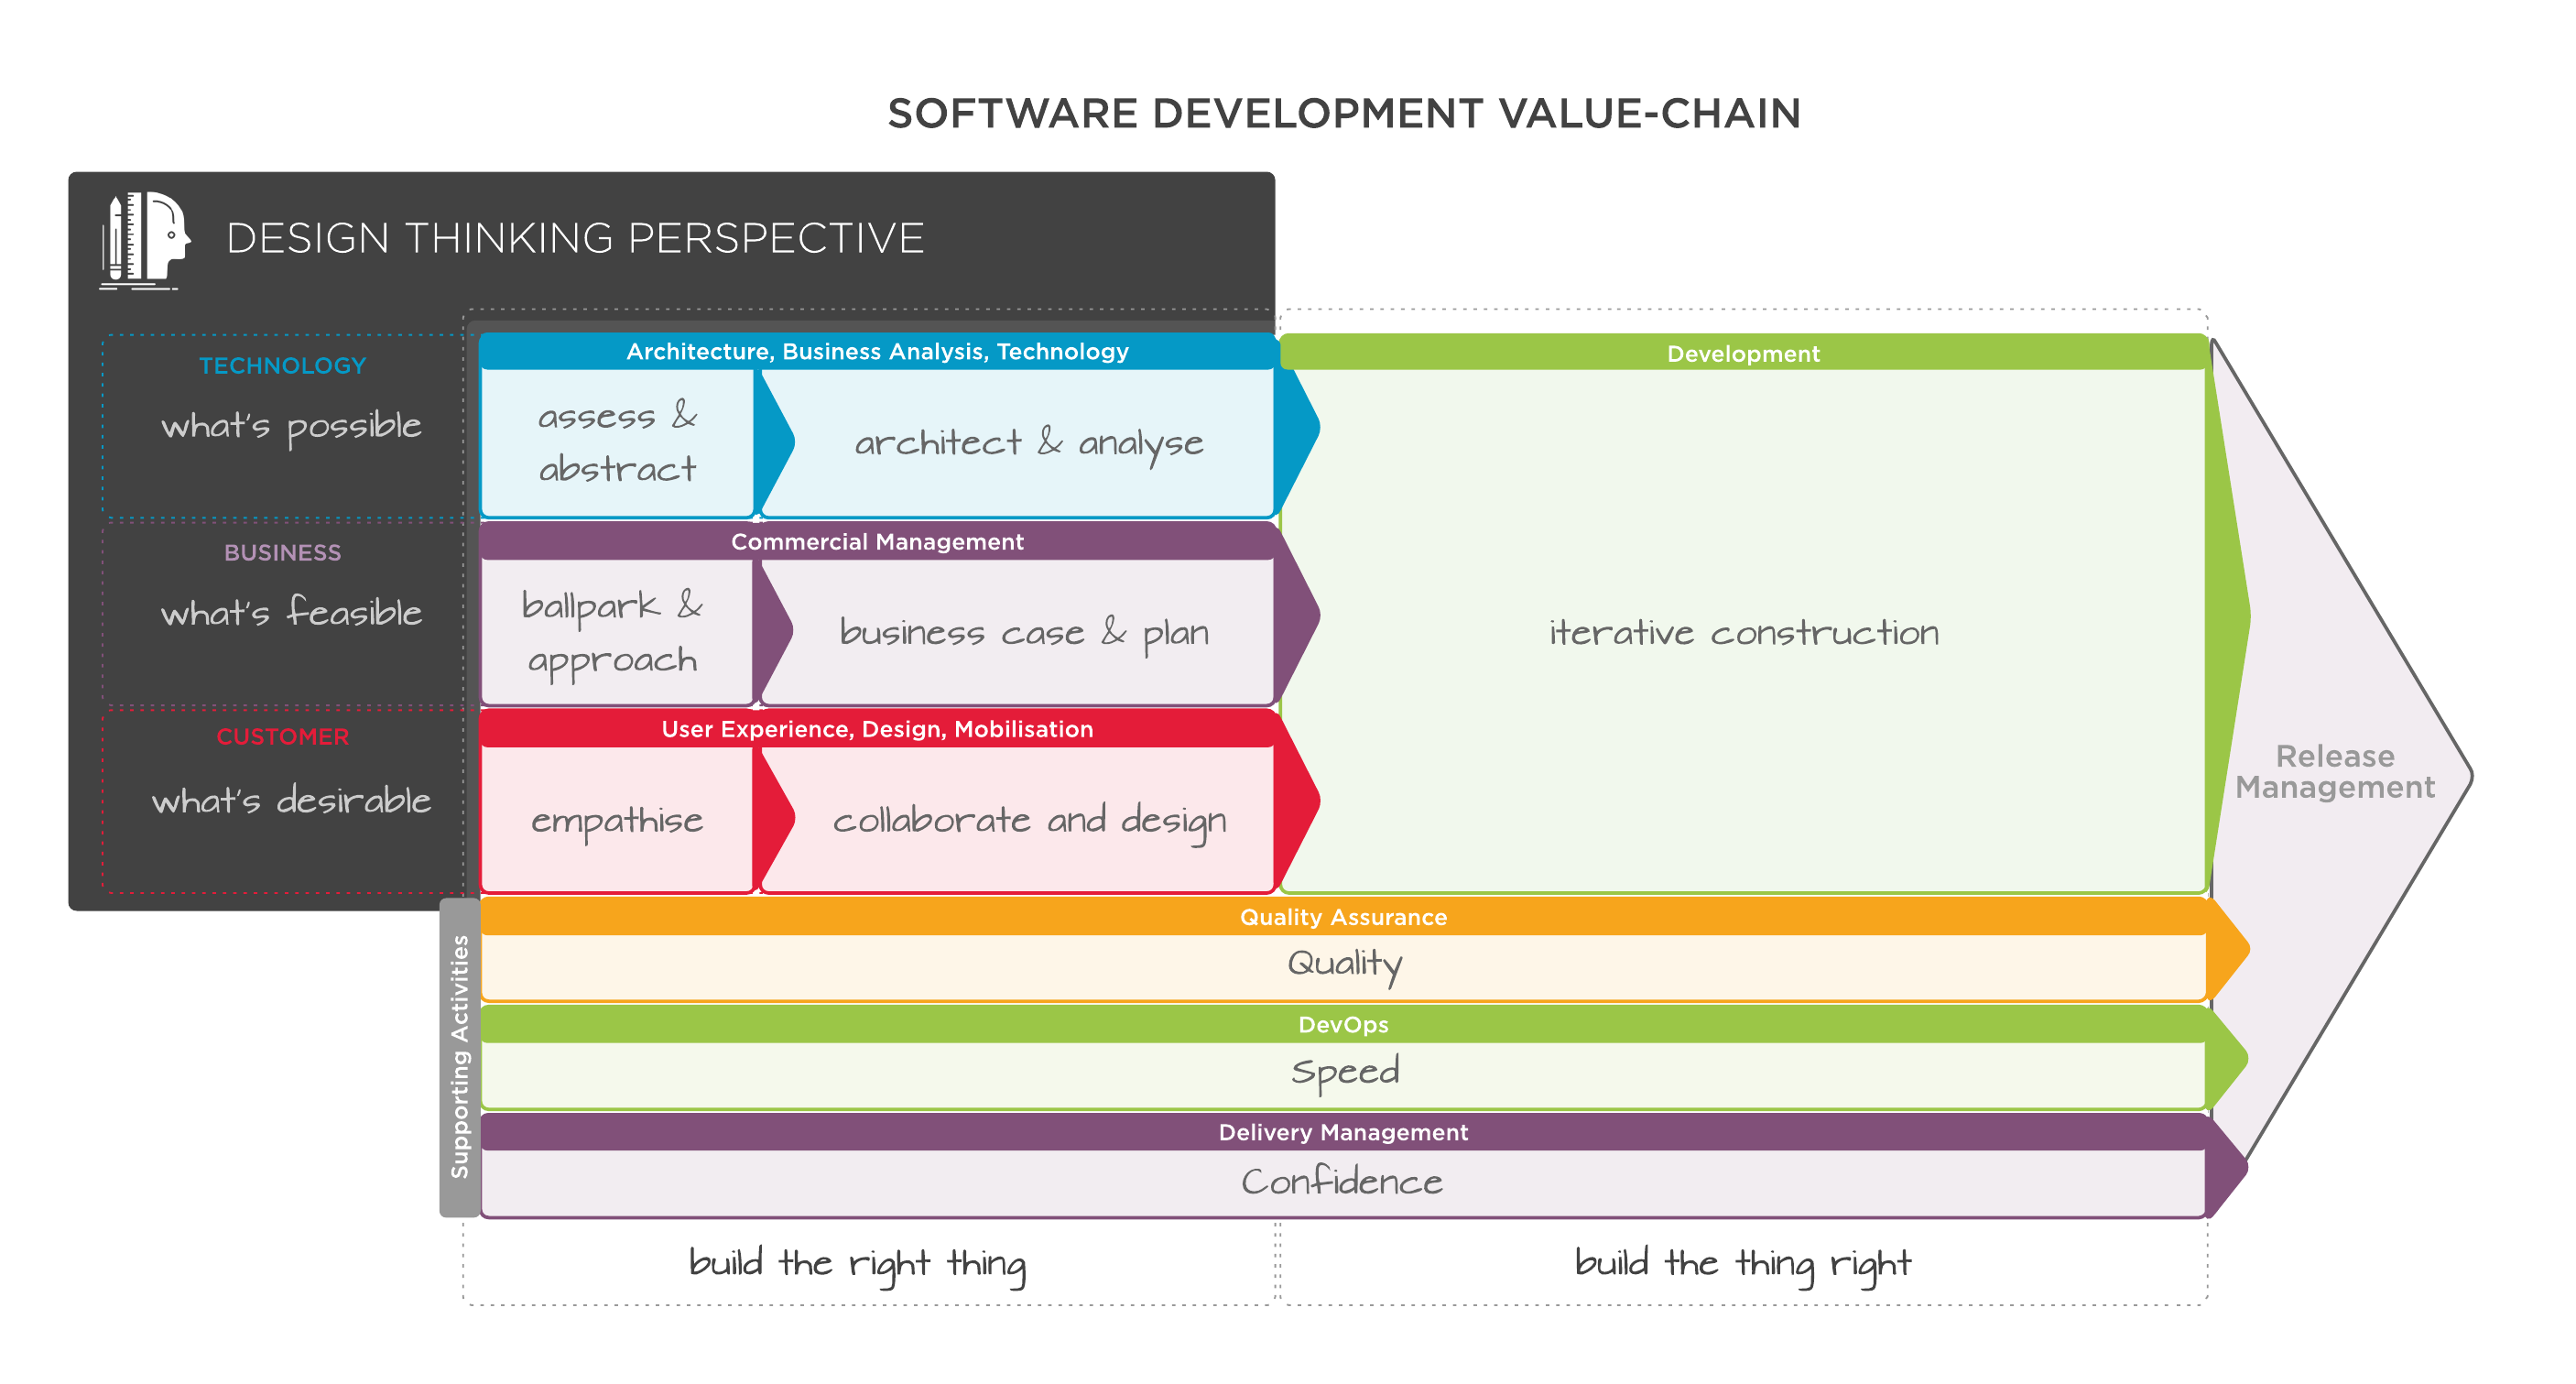
Design Thinking and Software Development
Design Thinking has really had a major impact on the way we innovate within software teams. I thought it would be interesting to illustrate how it could integrate with the software development lifecycle - showing how it aligns to a solution team.
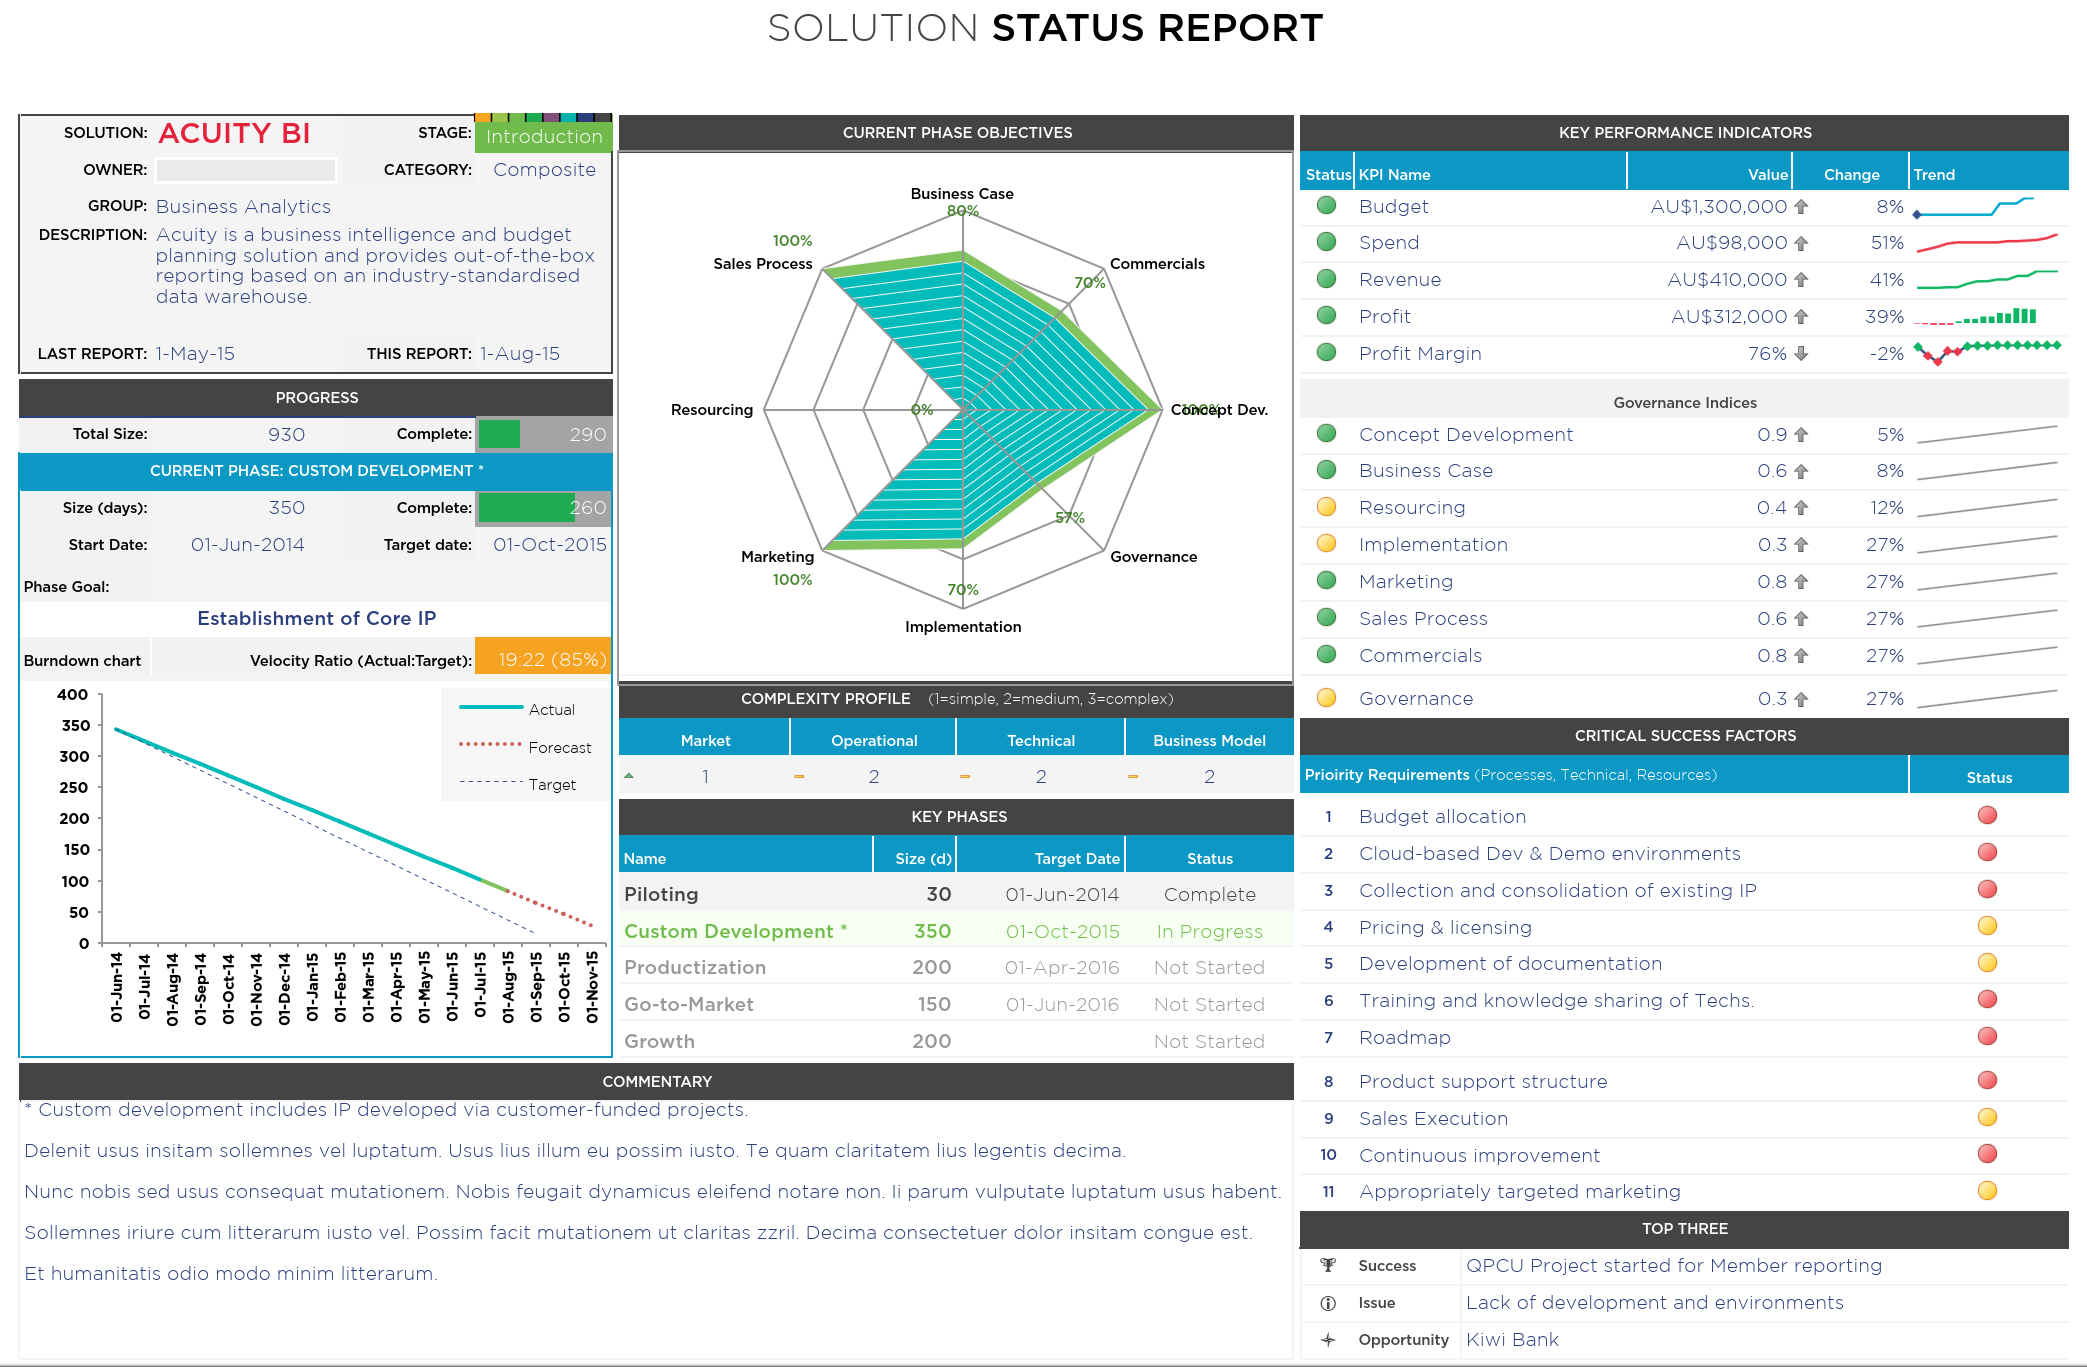
Governance Reporting
We needed a lean and rapid way to manage a number of key internal innovation initiatives that had all begun across the company. I pulled together this dashboard in Excel - identifying key dimensions and metrics.
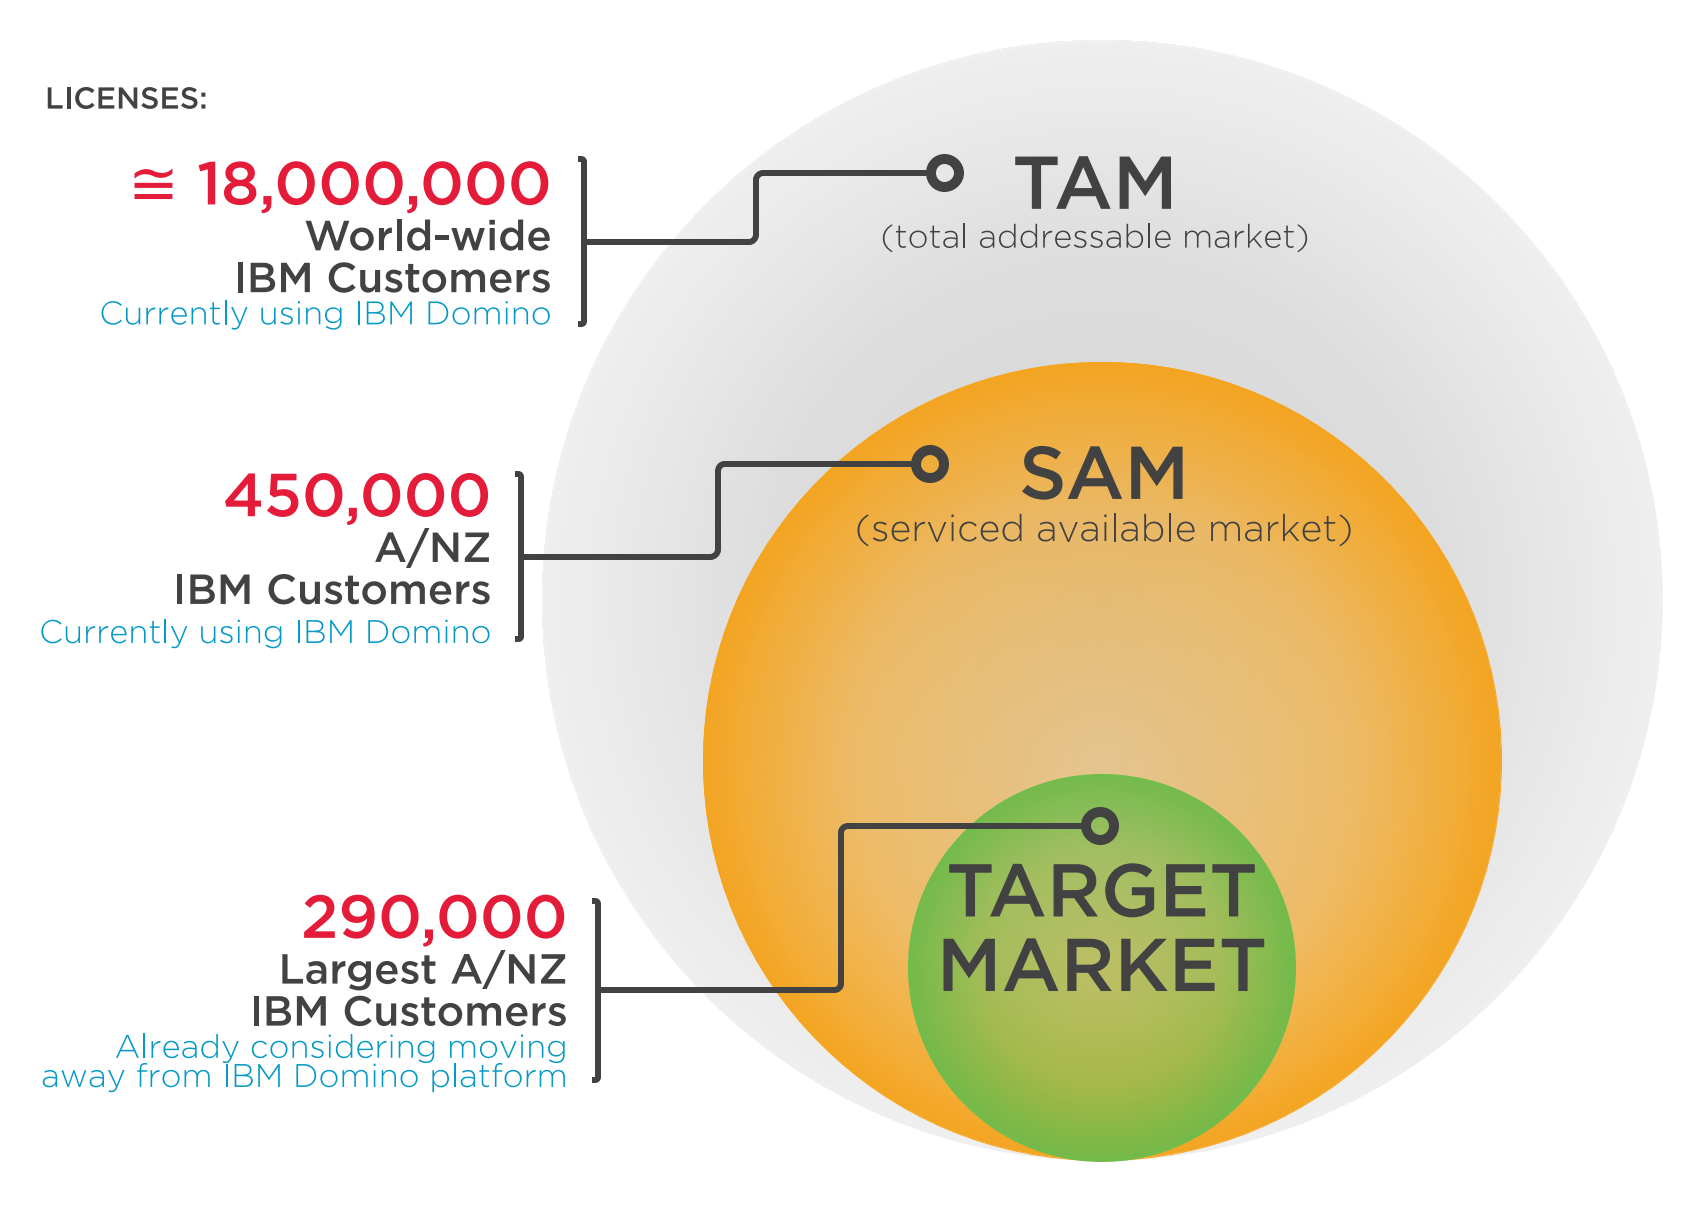
Market Sizing
There are different ways to construct a model for market sizing. Here is a classic top-down model. The one shown here suits situations where there is a large known market.
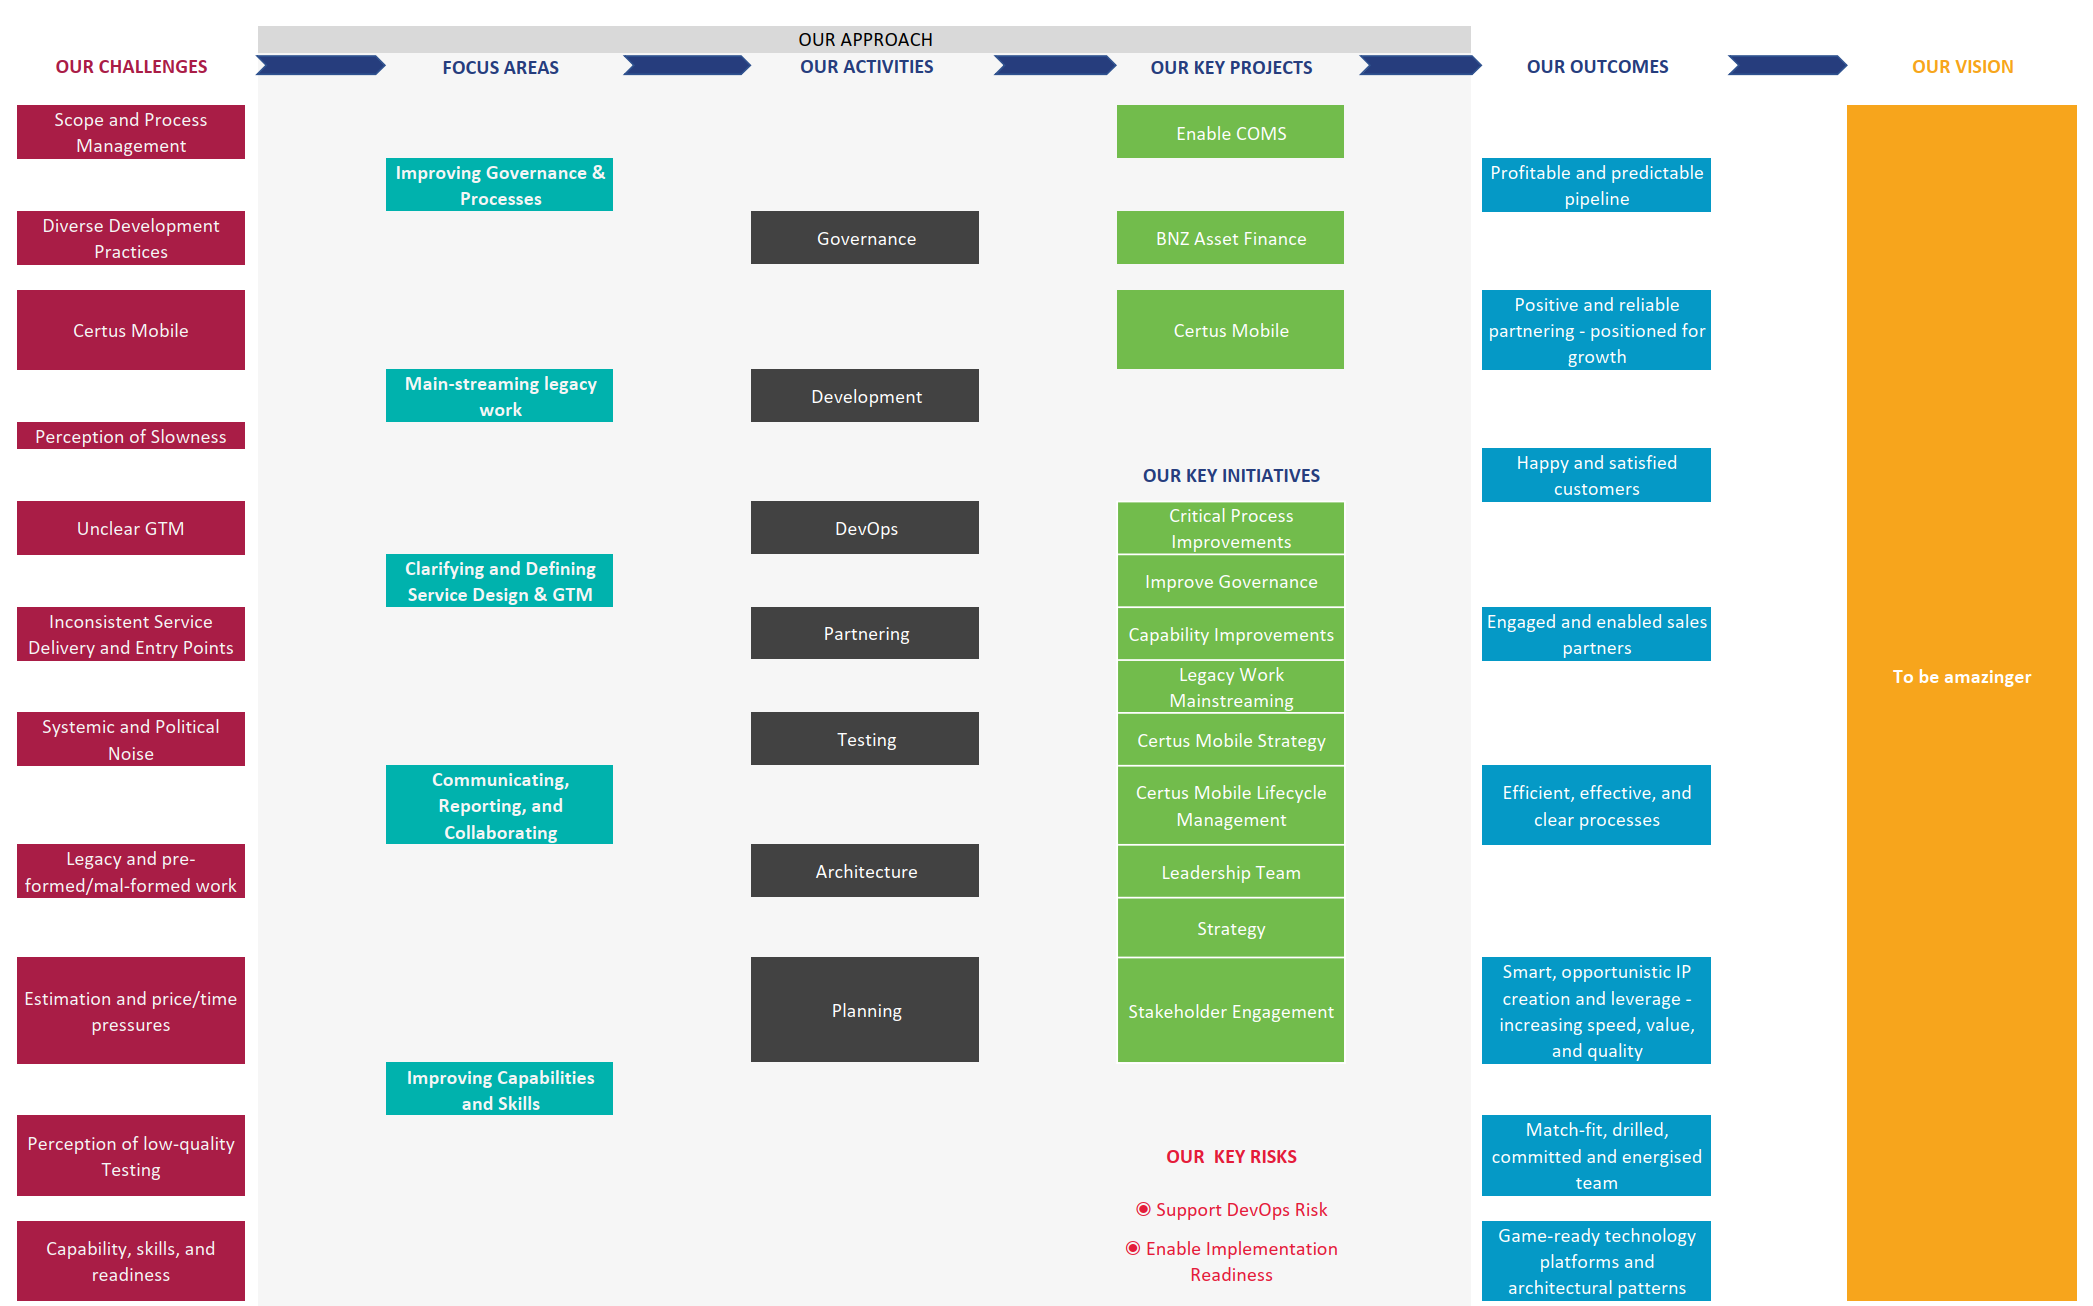
Operational Strategy
A good operational strategy shows how you will get from where you are to where you want to be. It has to deal with reality, but connect it to the vision.
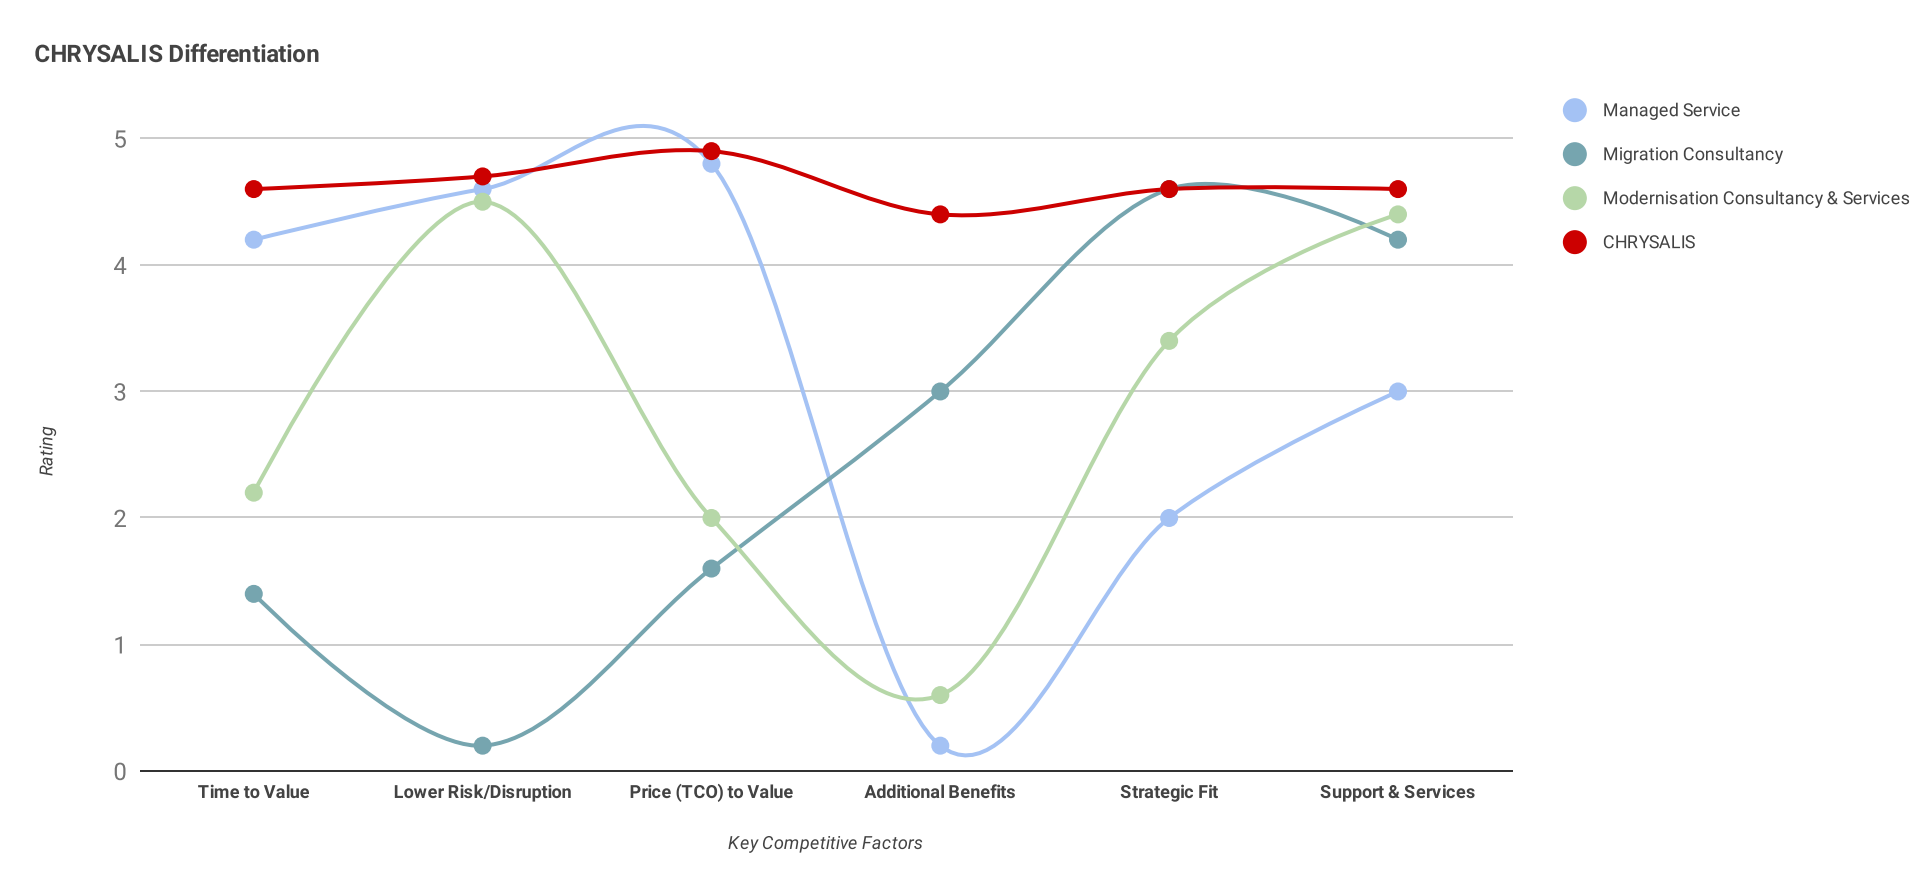
Produce Value Curve Analysis
It’s important to identify key competitive factors that will impact the success of your product. By evaluating competitor products using the same criteria, you can ensure you have a compelling offering. It also help with positioning and sales enablement.
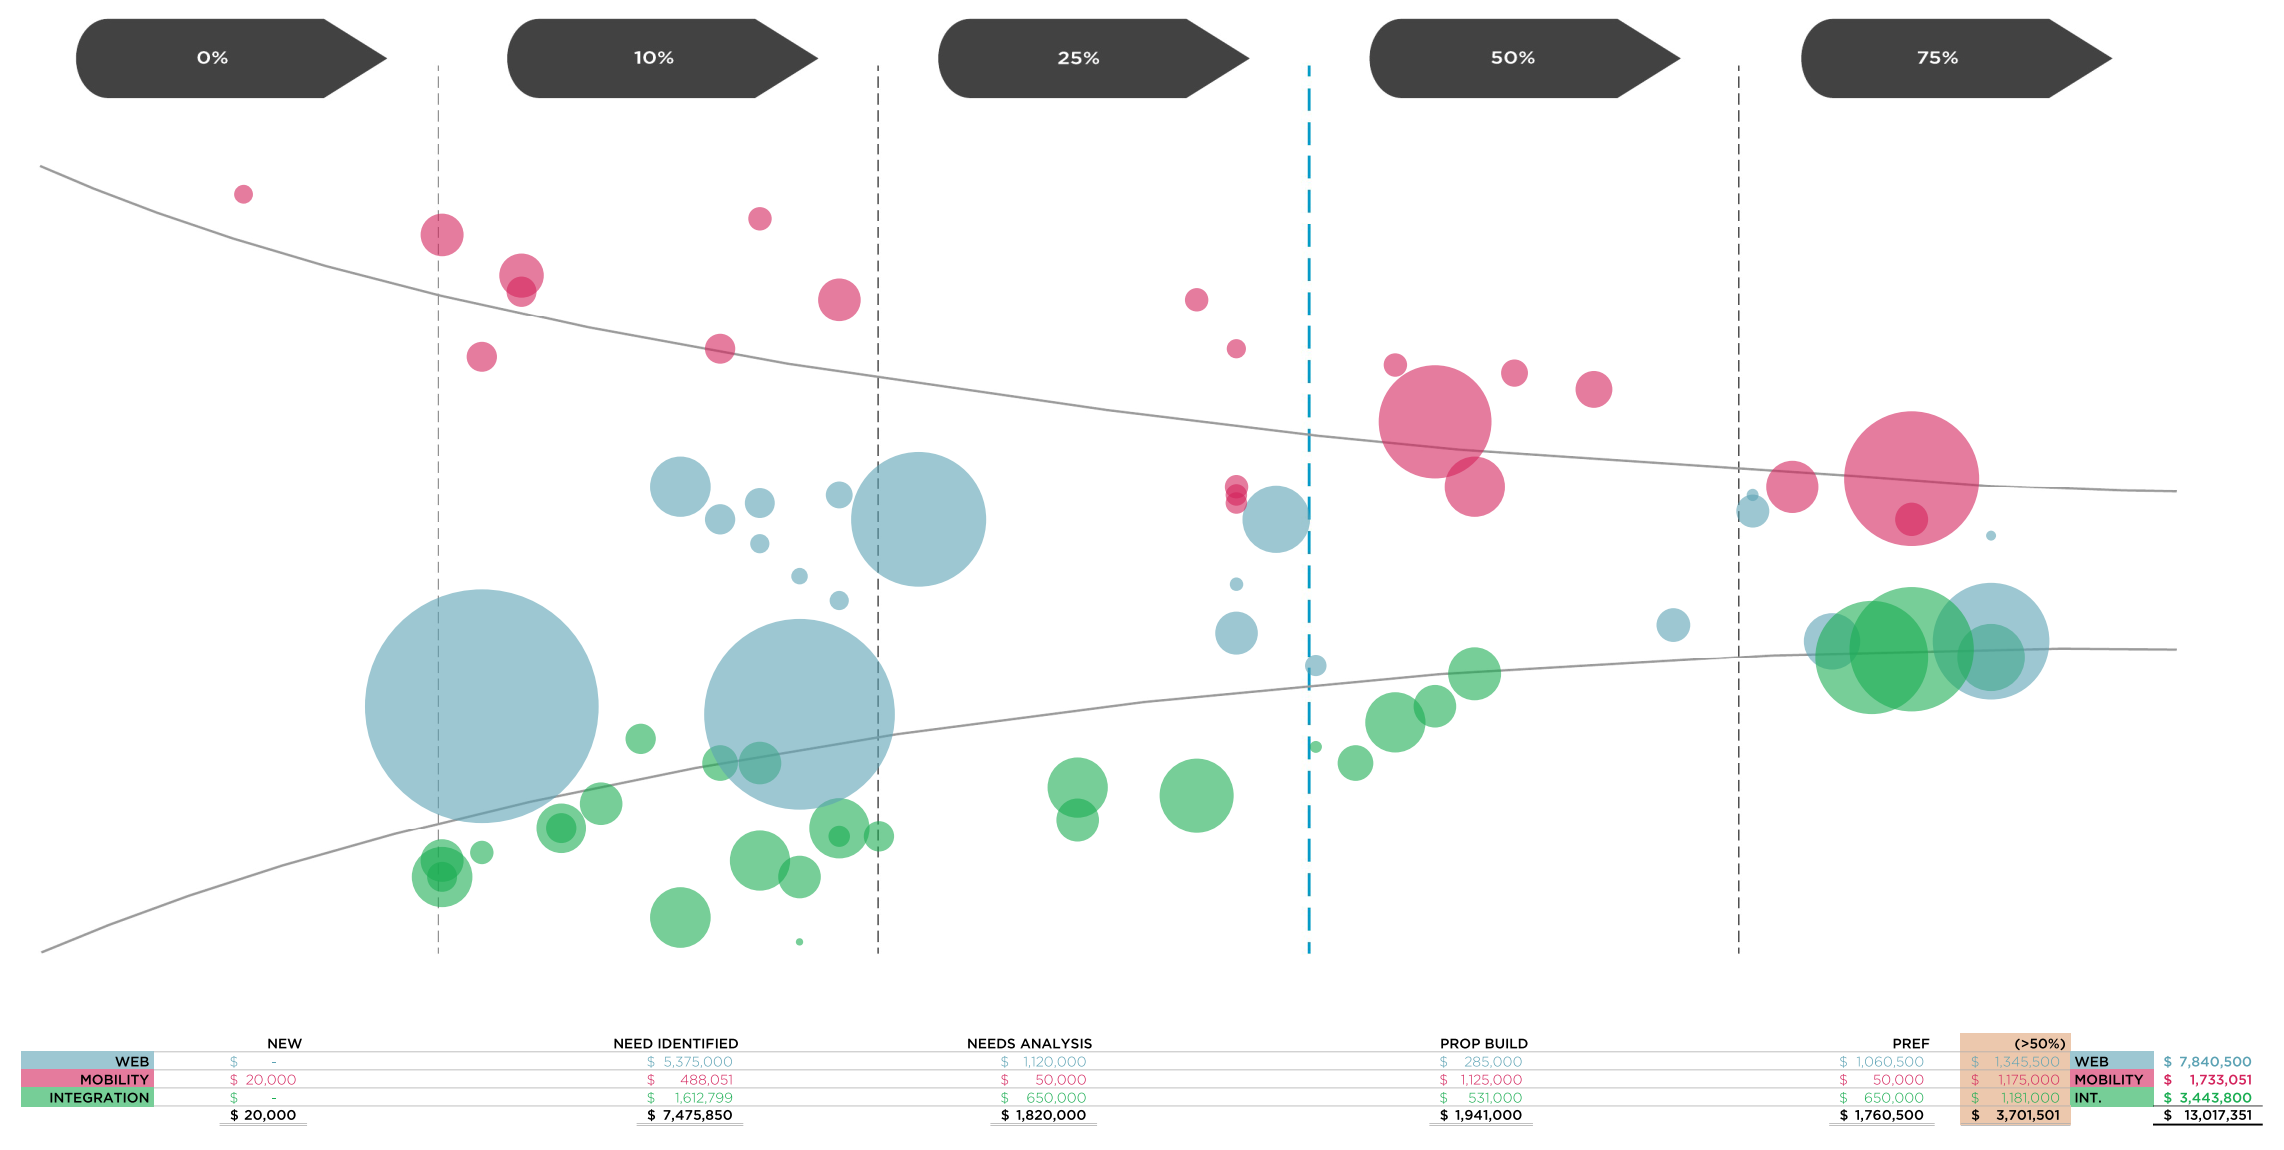
Sales Pipeline Modeling
This is a visualisation of a sales pipeline. It’s a bubble chart mapping sales stage to the horizontal axis, and opportunity size to the size of each data point. I’ve applied an arbitrary algorithm to create the funnel effect on the vertical axis.
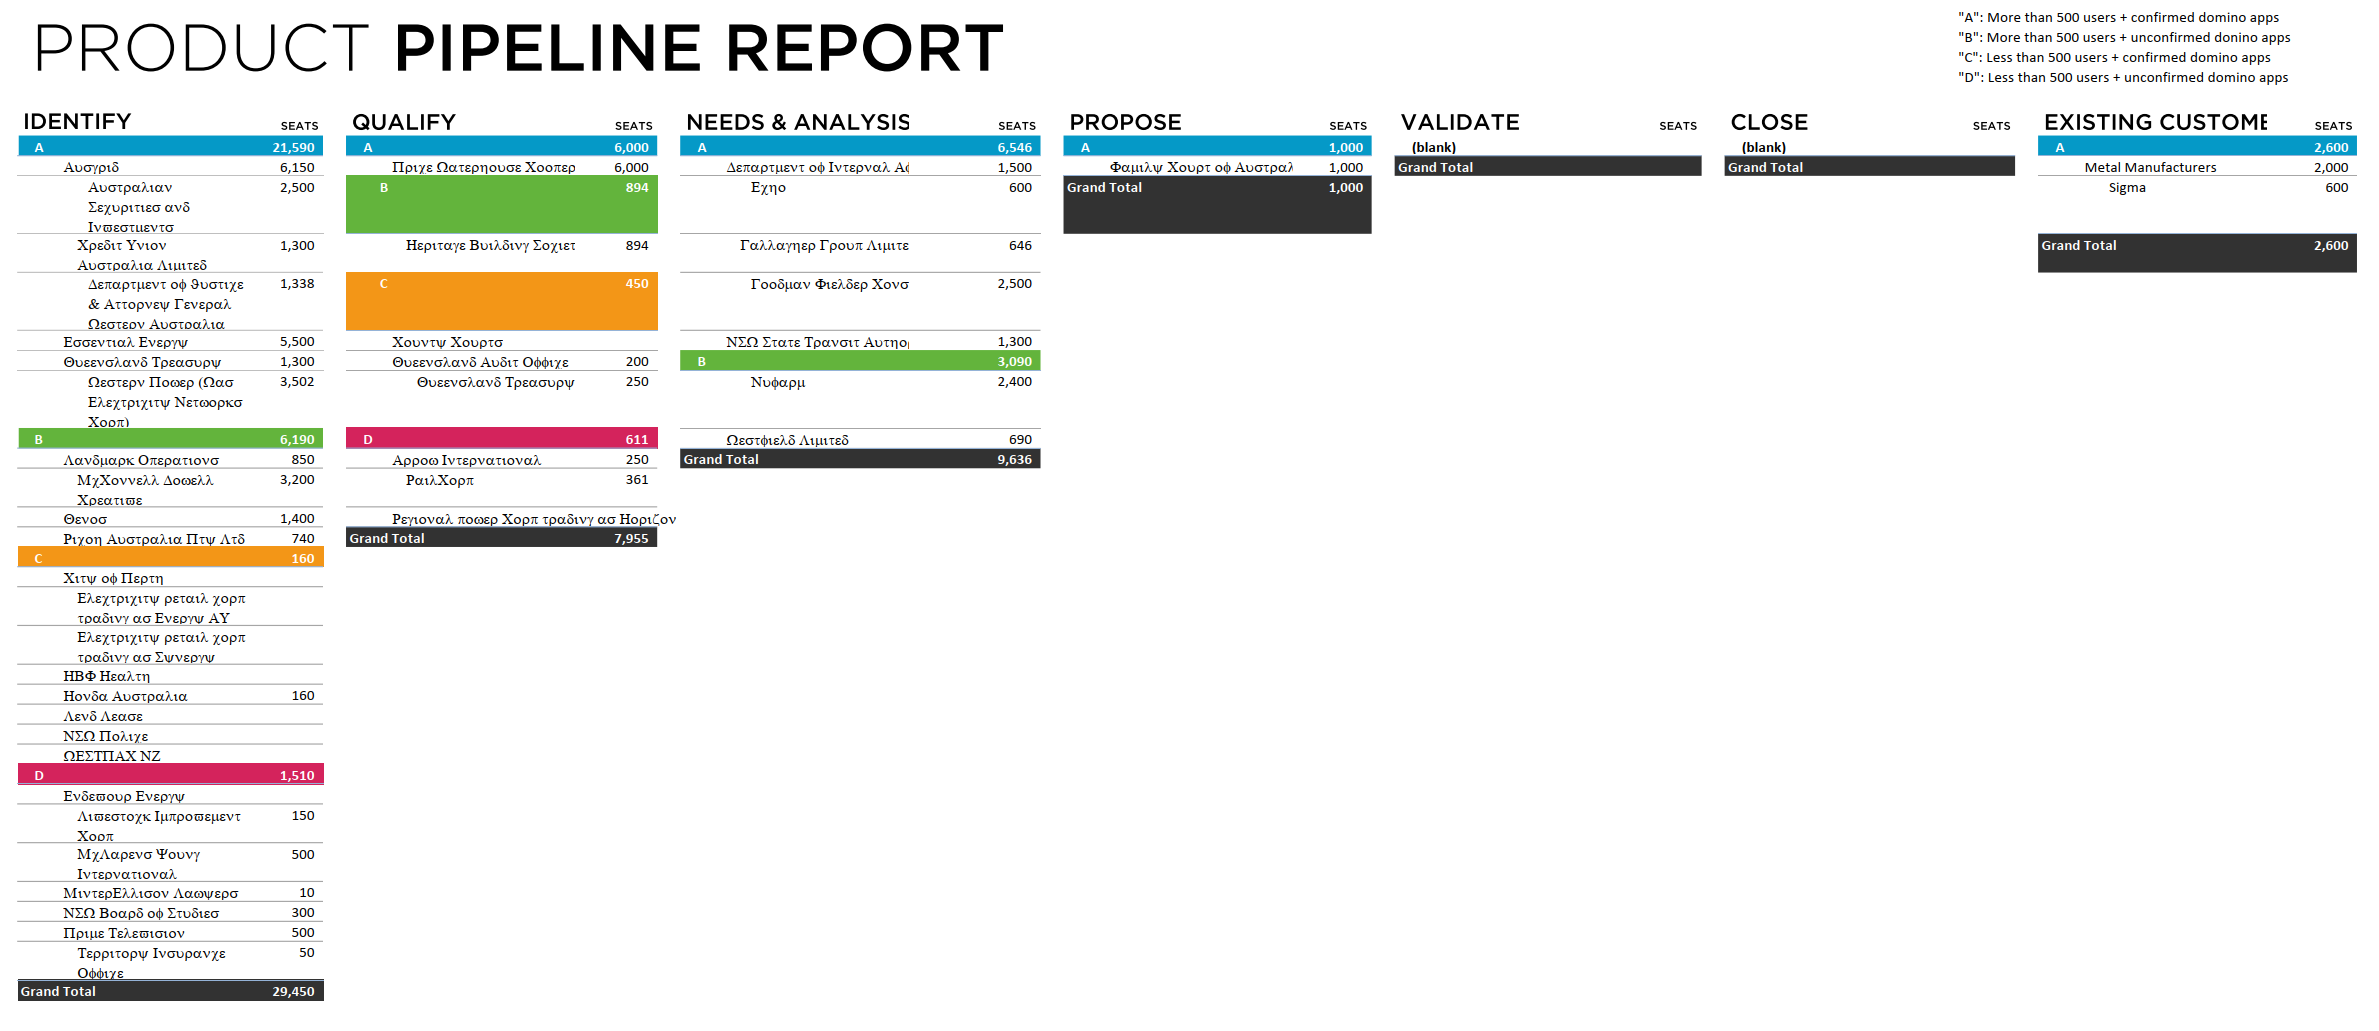
Sales Pipeline Report
This is an example sales pipeline report for a product. At each stage, the prospects are grouped into colour-coded priority targets - to help drive focus.
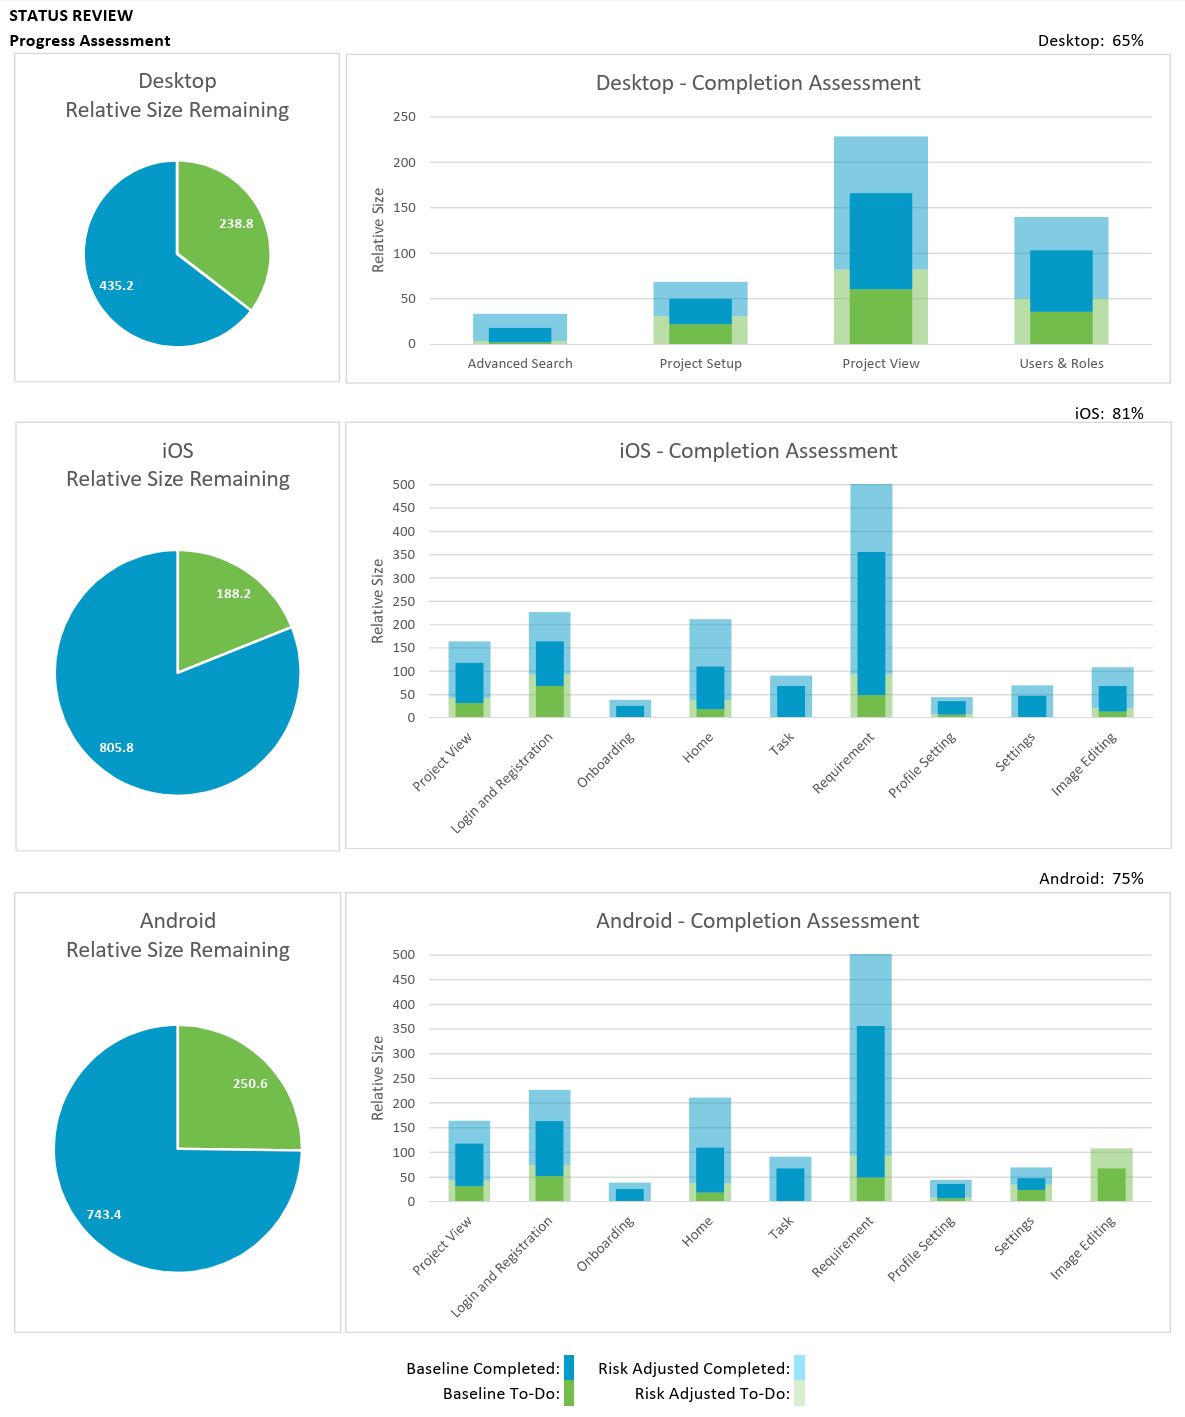
Software Estimation
There are many different ways to estimate software - depending on the timeframe and quality constraints. I’ve refined a number of techniques - and often find the best way is to combine them to fit the situation.
Solution Technology Review
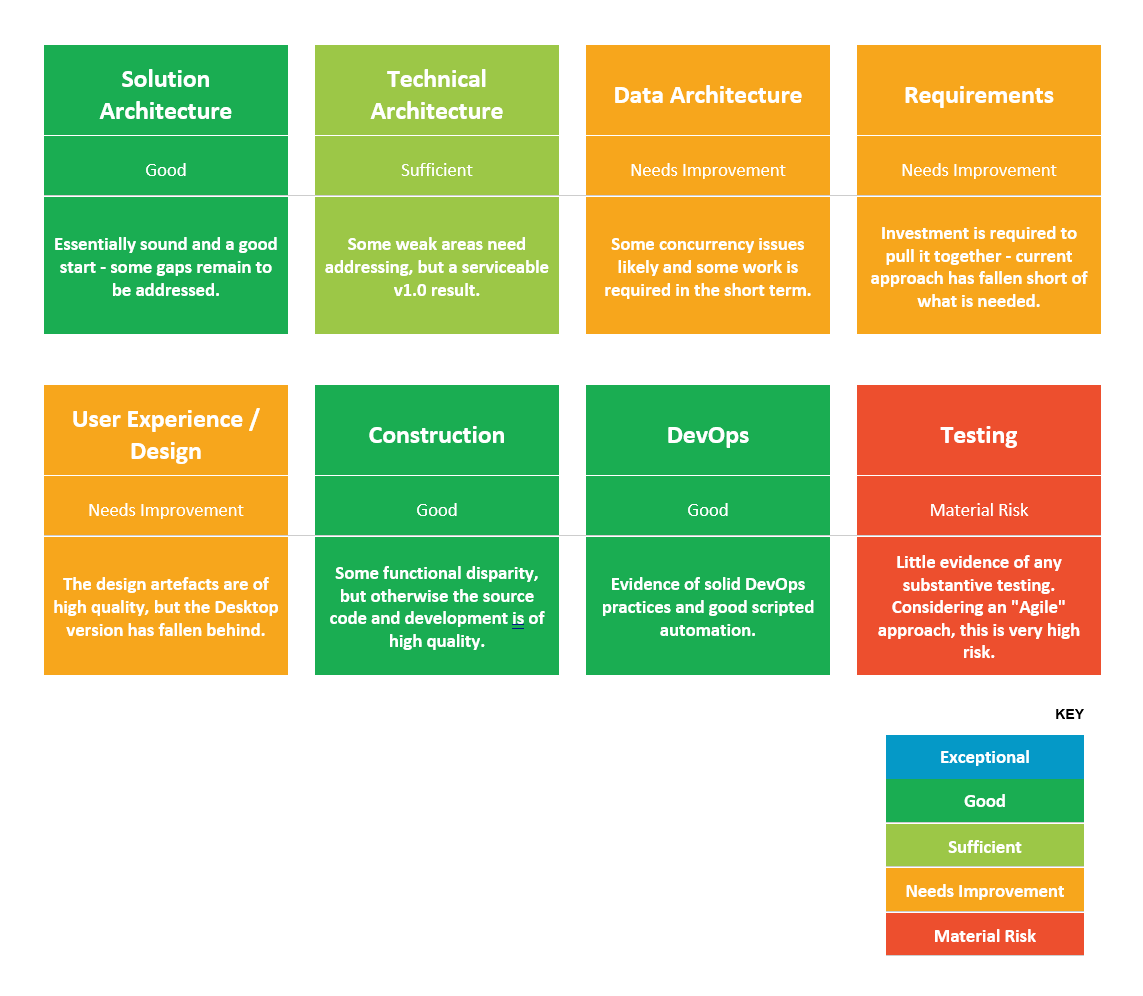
This is a qualitative report card produced for some inherited enterprise software code base. I designed the dimensions to ensure we produced an holistic view. Speed was vital - so there are no time to become bogged down in analysis paralysis. So I created set of survey tools for each dimension and had relevant experts provide their input.
Component Modeling
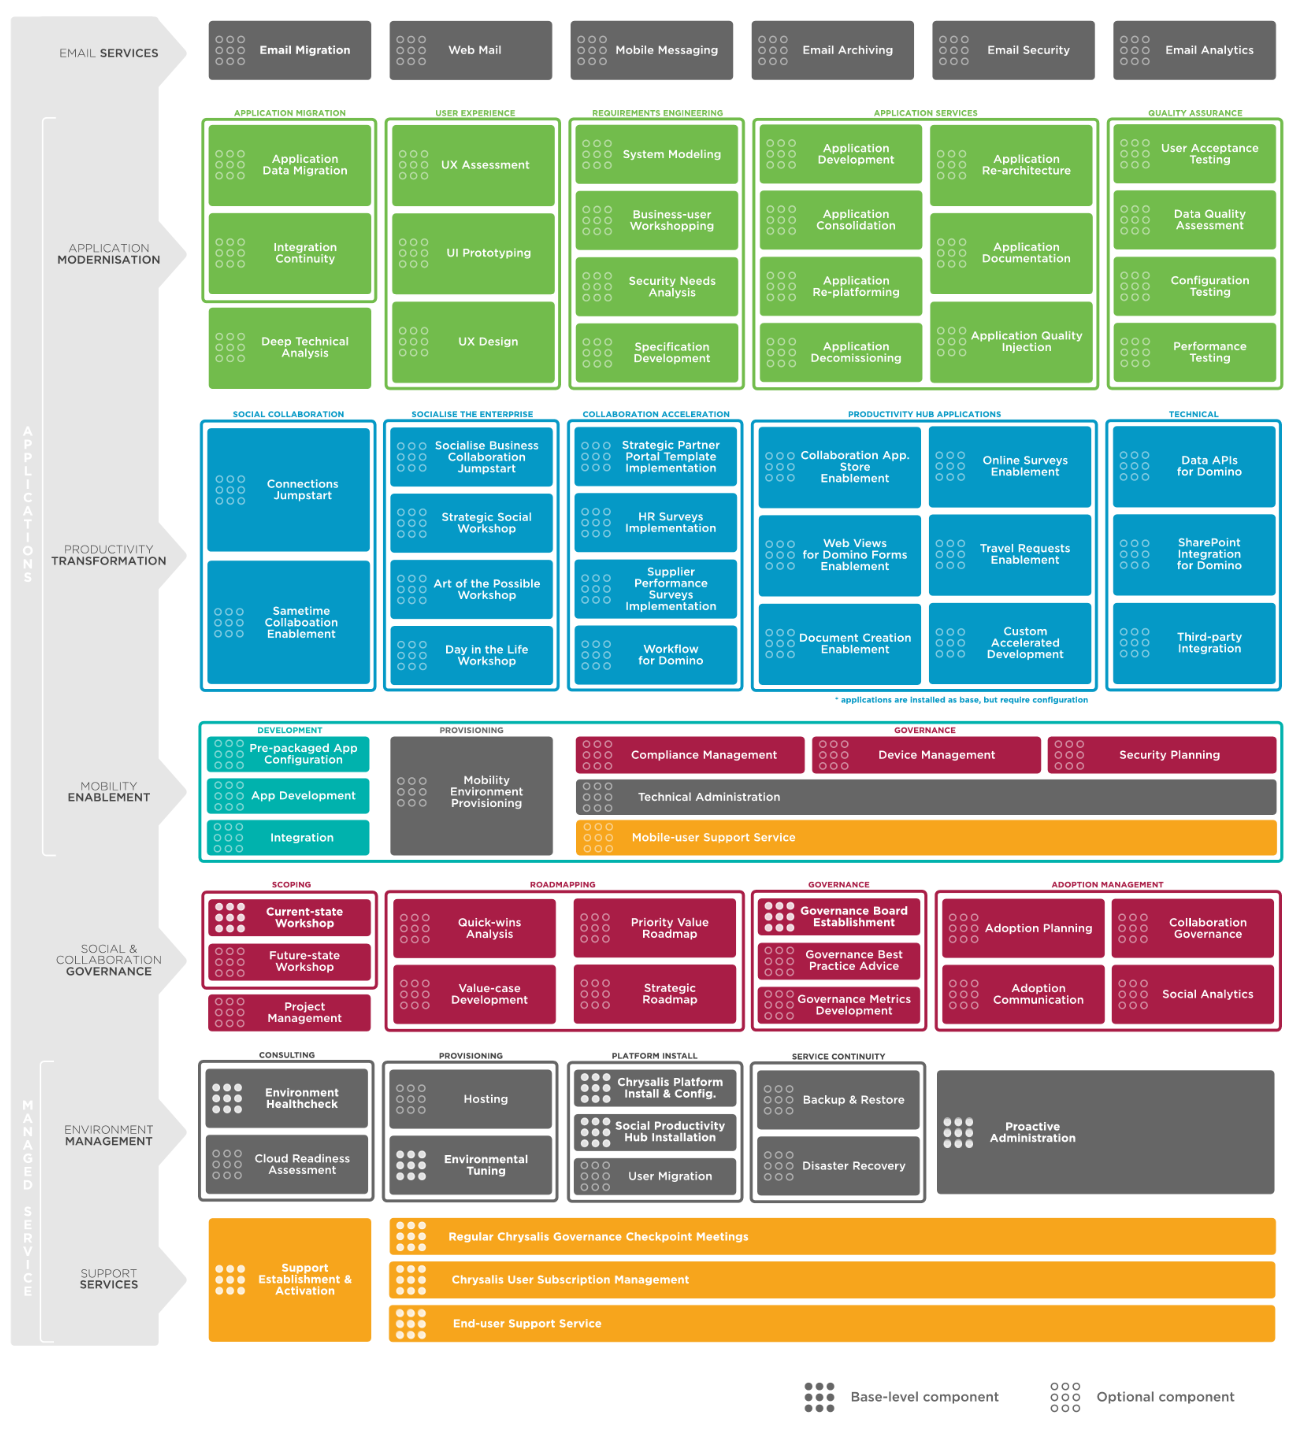
Pulling together large composite products - involving consulting, technology, and services components - requires strong conceptual ability combined with excellent integration skills.

Agile Reporting
Real-time transparency is a vital part of Agile. It means you can build confidence with stakeholders even as clarity is still forming and things are changing.
Capability Management
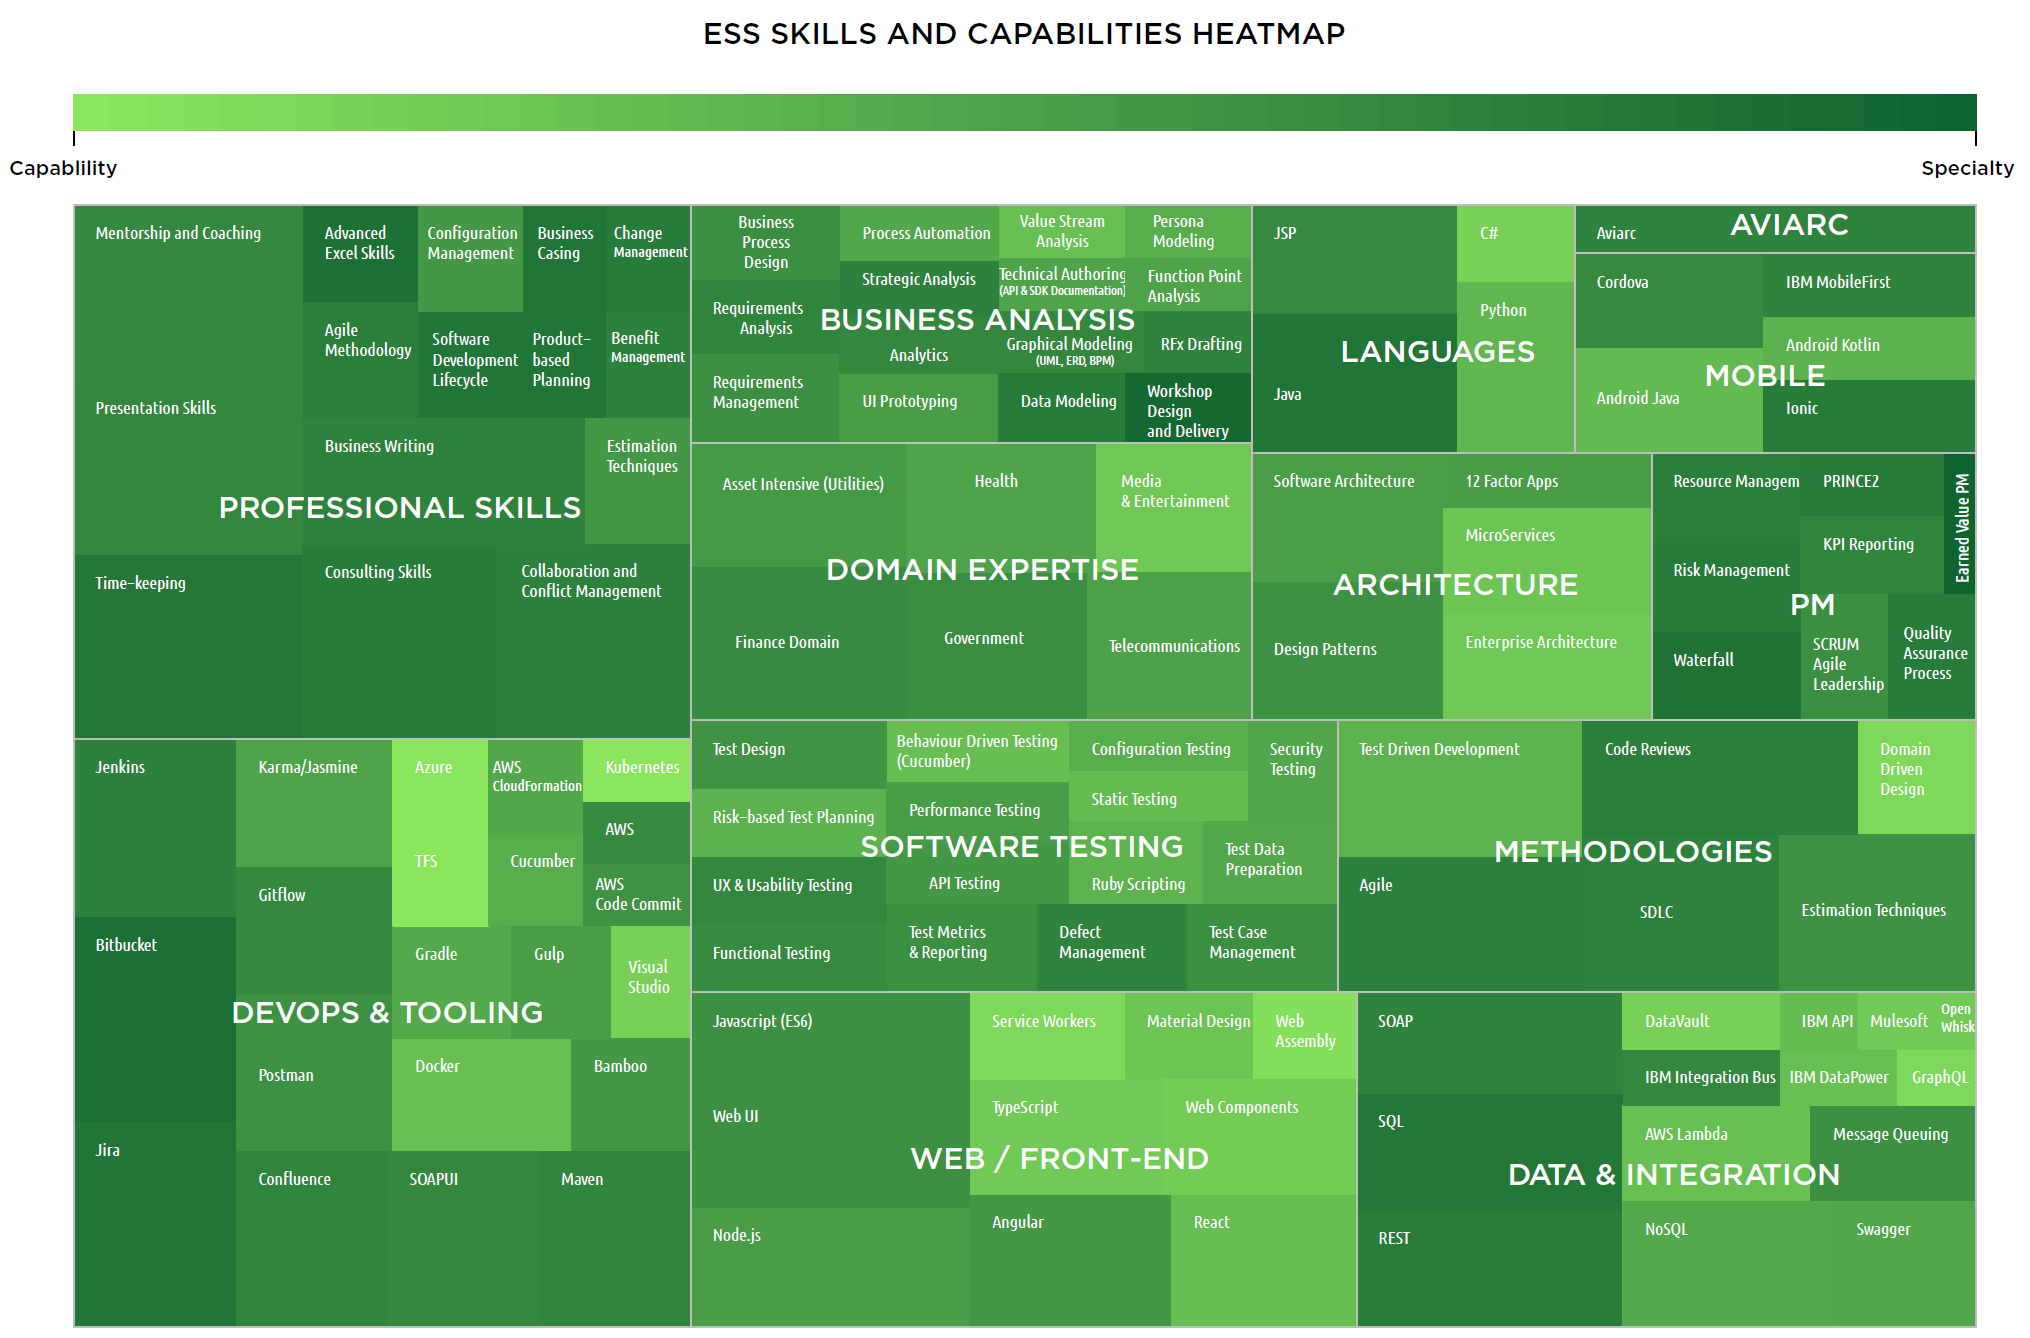
It can be helpful to see the big picture - to visualise and communicate the entirety of the capability you can field. This heatmap was created in R Studio using aggregate survey data.
Customer Segmentation
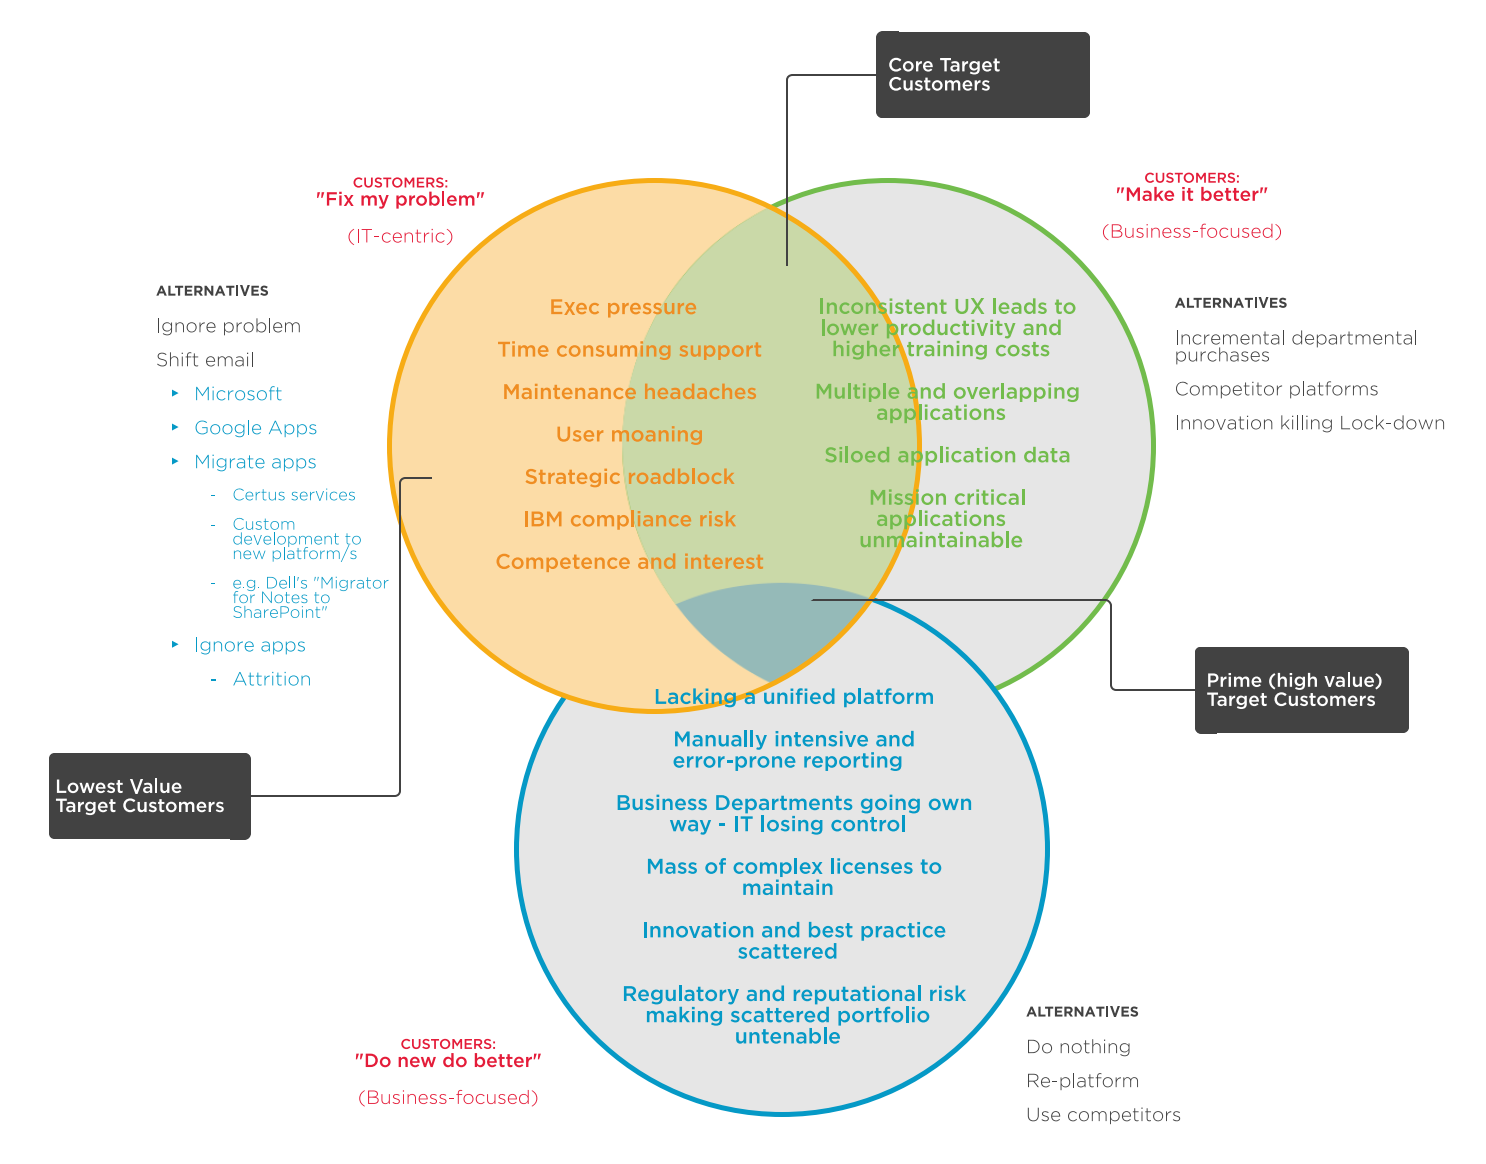
One of the best ways to isolate the kind of differentiation needed to make headway in a competitive market is to look for value-propositions that intersect adjacent customer segments.
Hypothesis Testing
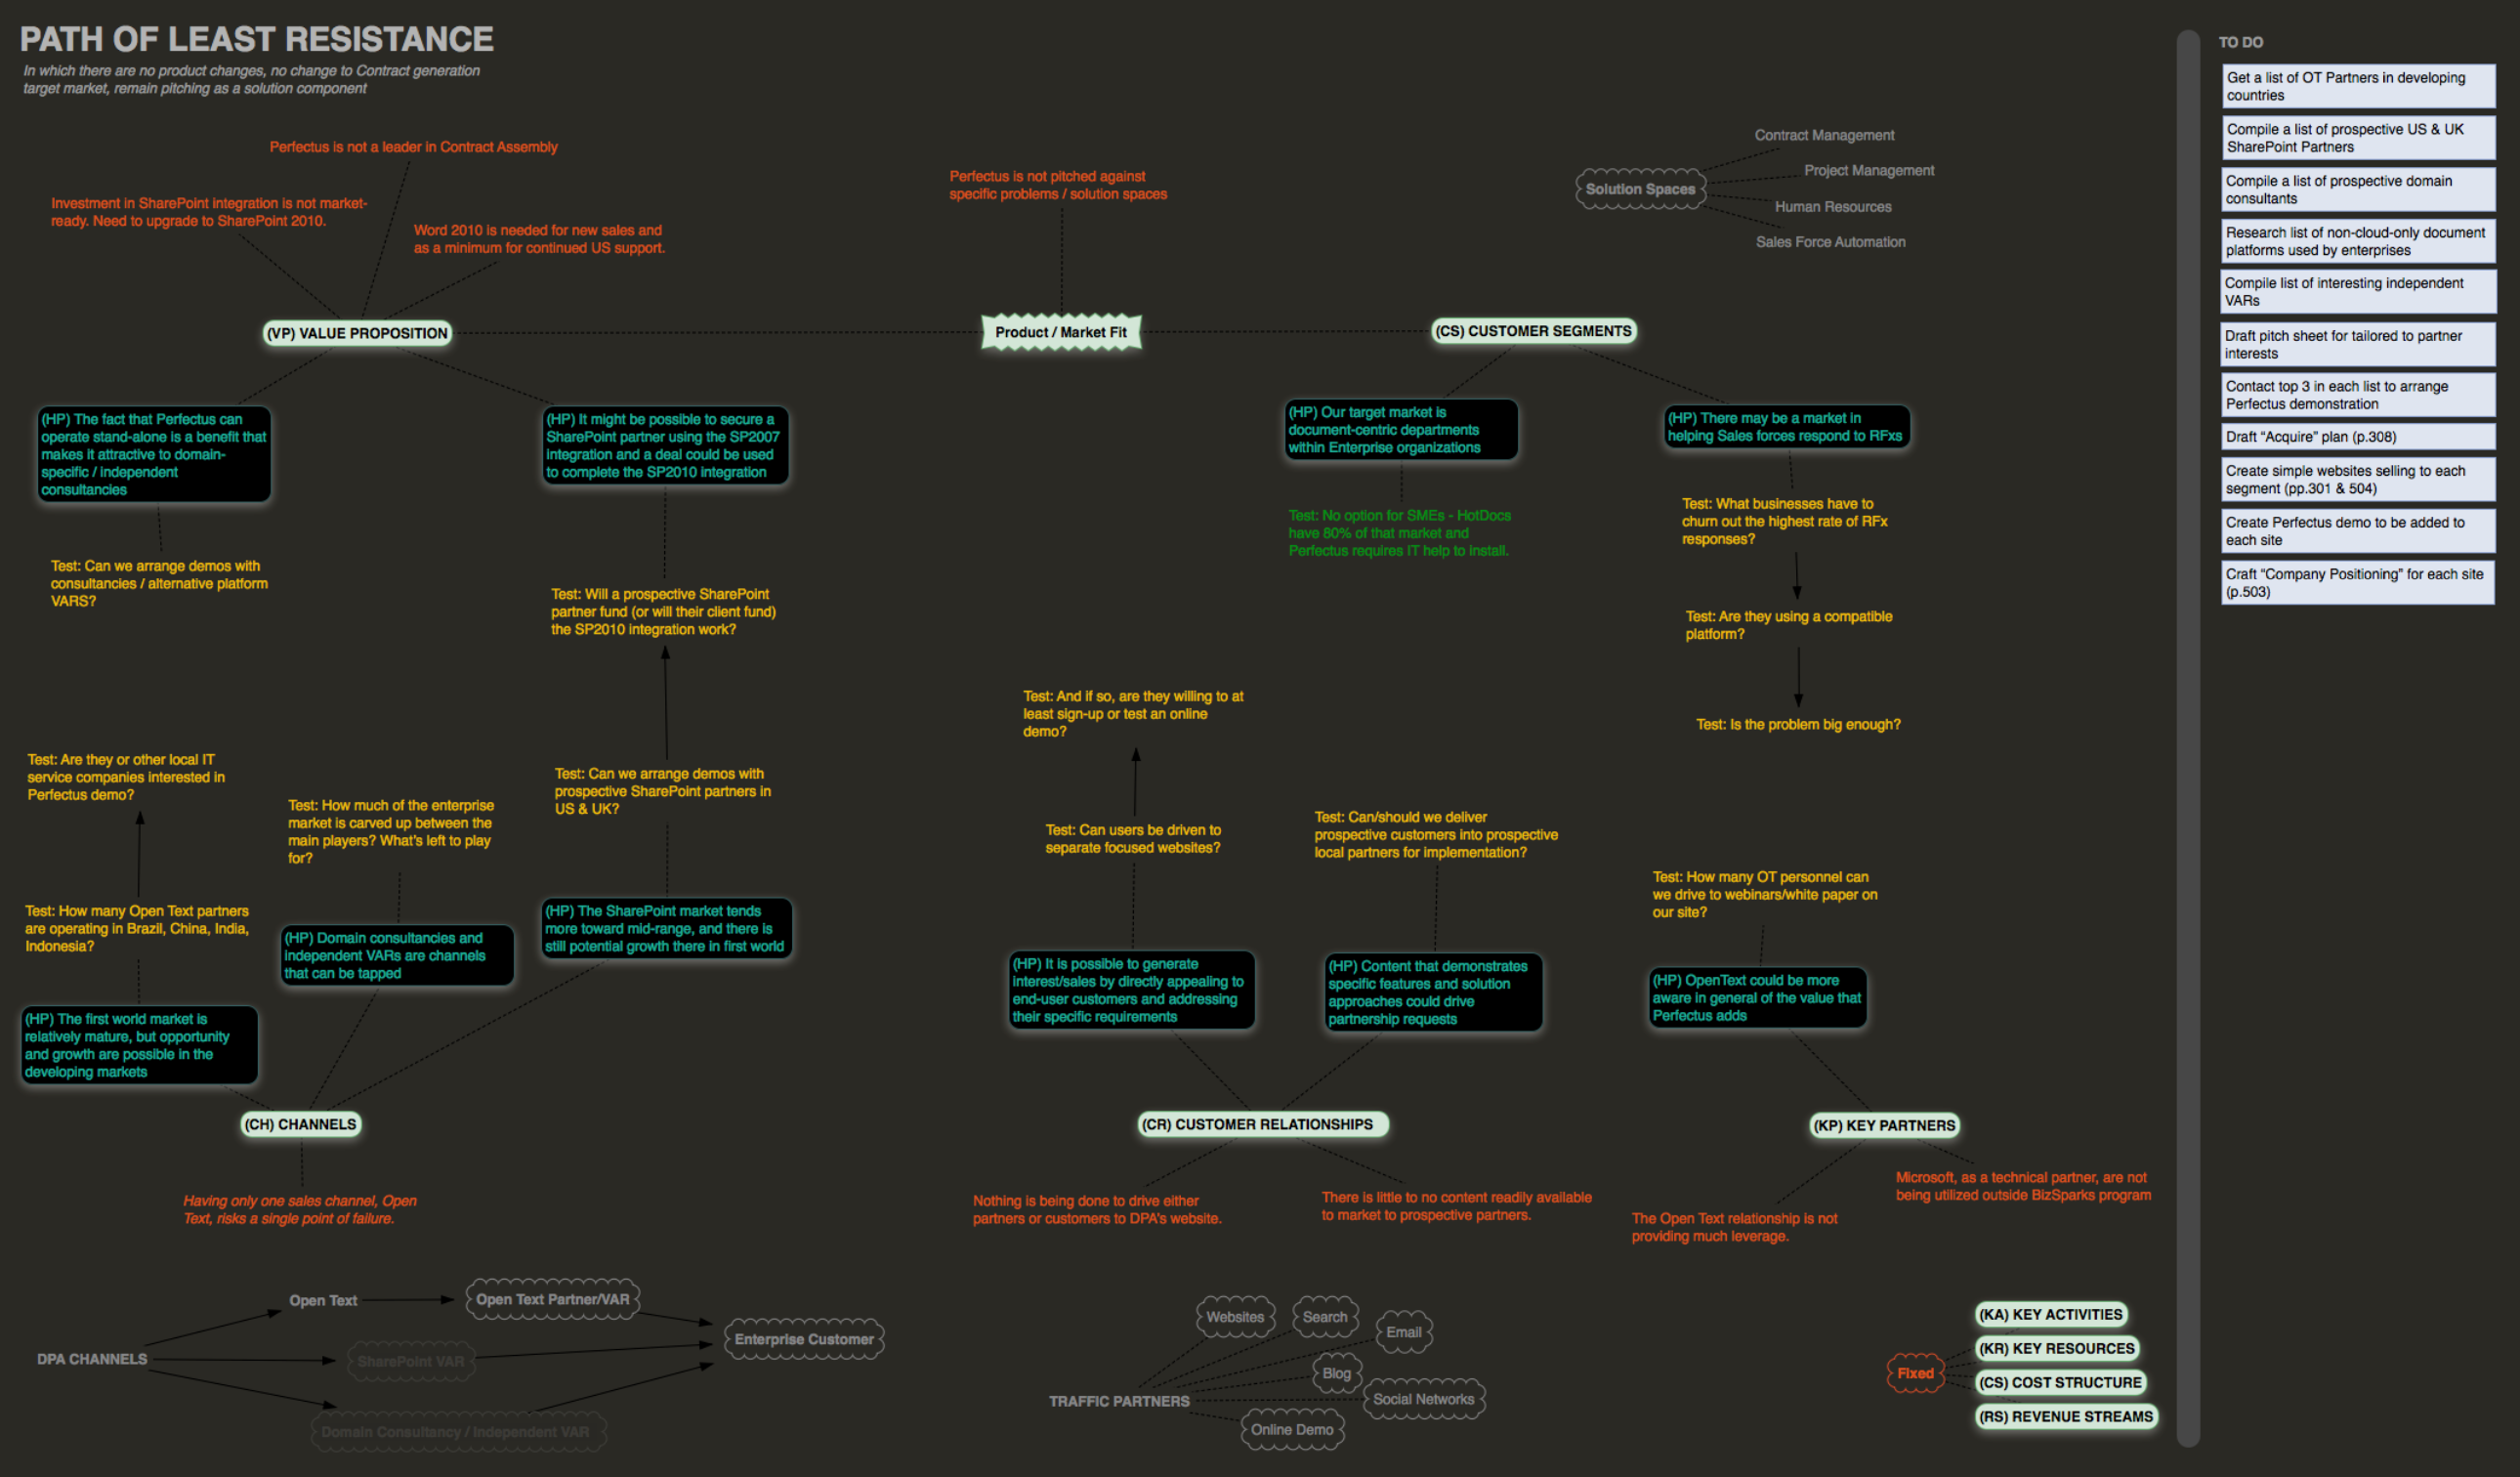
Experimentation is an important part of innovation. Here, I have taken key hypothesis from a business model canvas and identified tests in order to validate assumptions.
Operational Framework
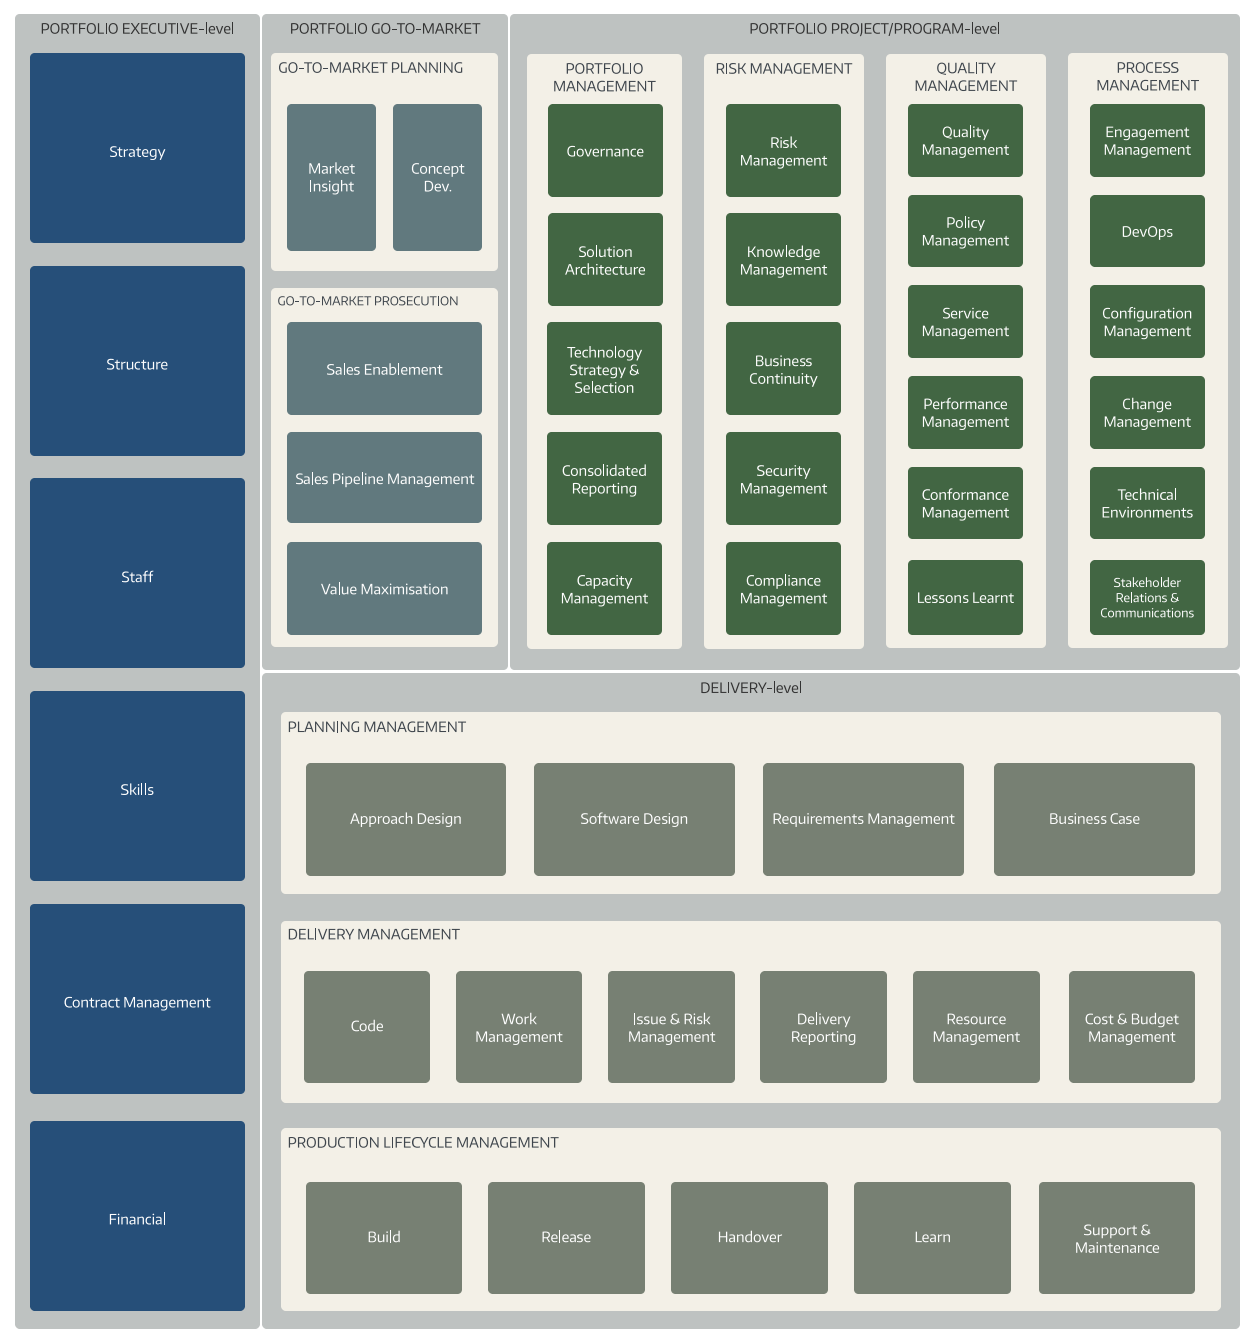
There’s a lot that goes into making software well. You’re doing it anyway, you may as well manage it well. This operational framework helps manage and mature processes through-out the business unit, and across all projects.
Process Radar
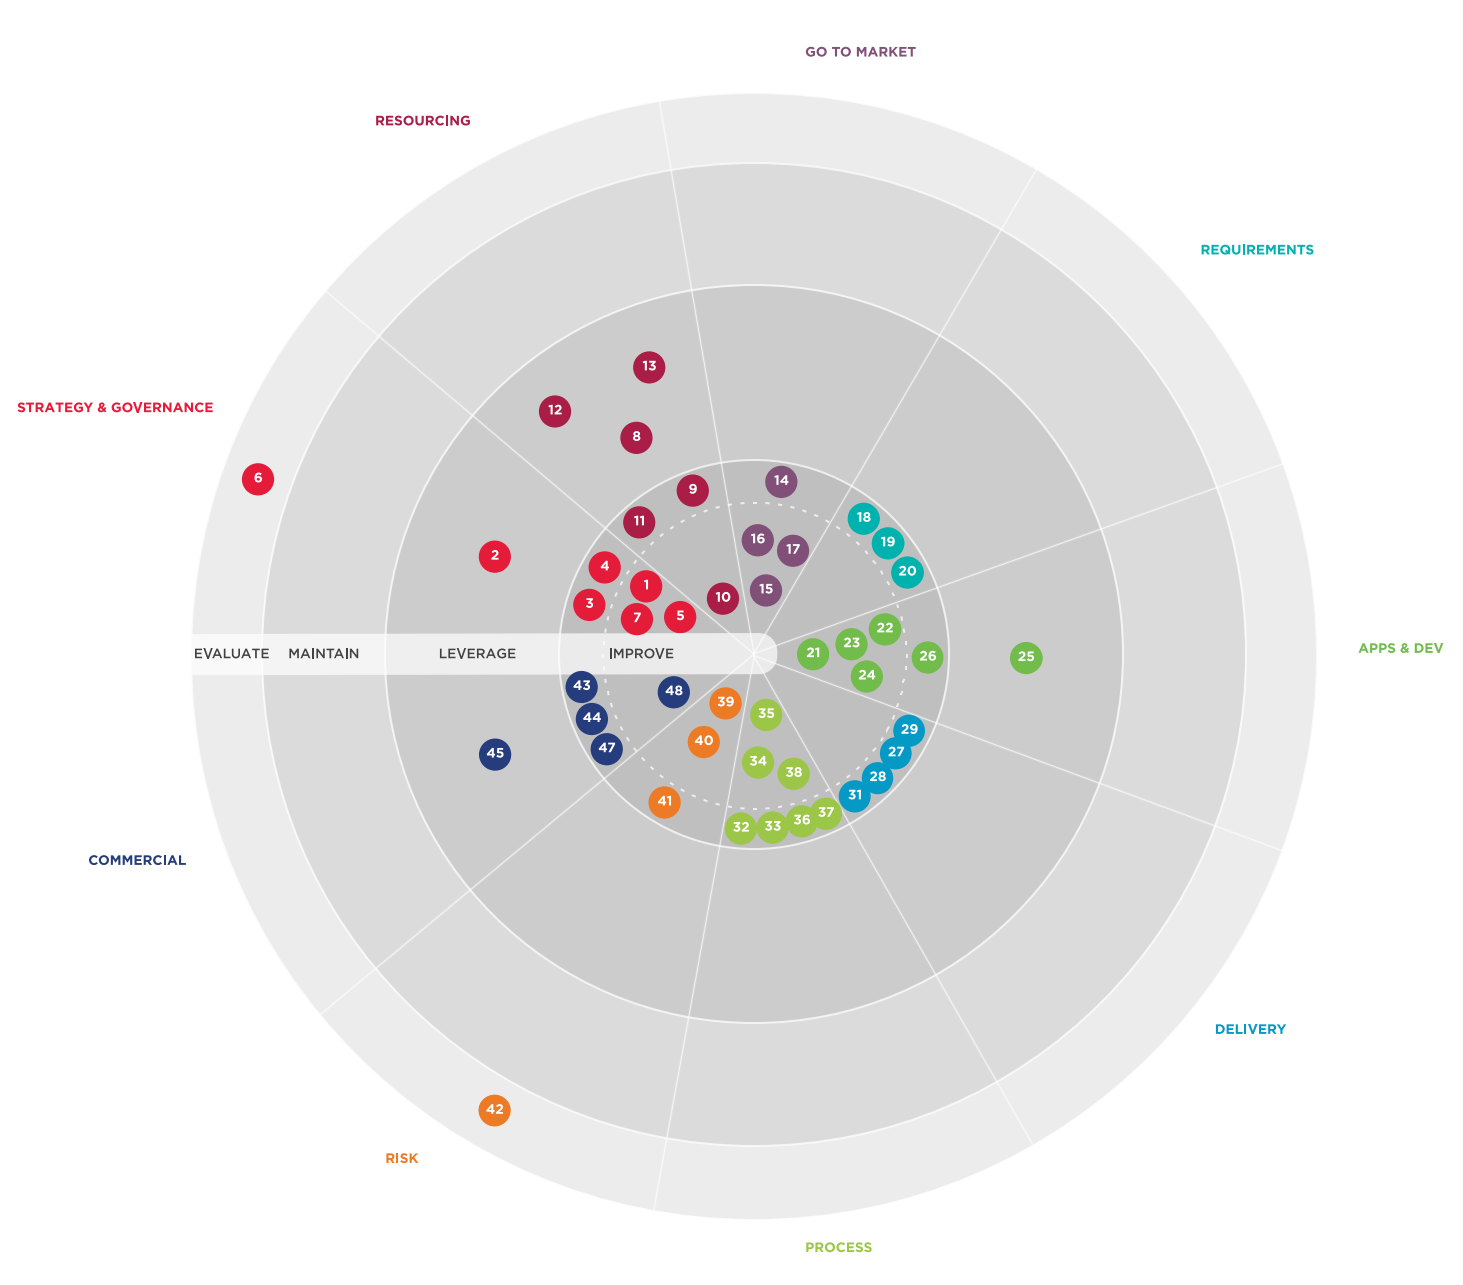
Inspired by ThoughtWorks’ TechRadar and Tech-Info’s approach to prioritising process improvement, here I’ve mapped all items from the Operational Framework on to a radar.
Product Flow Diagram
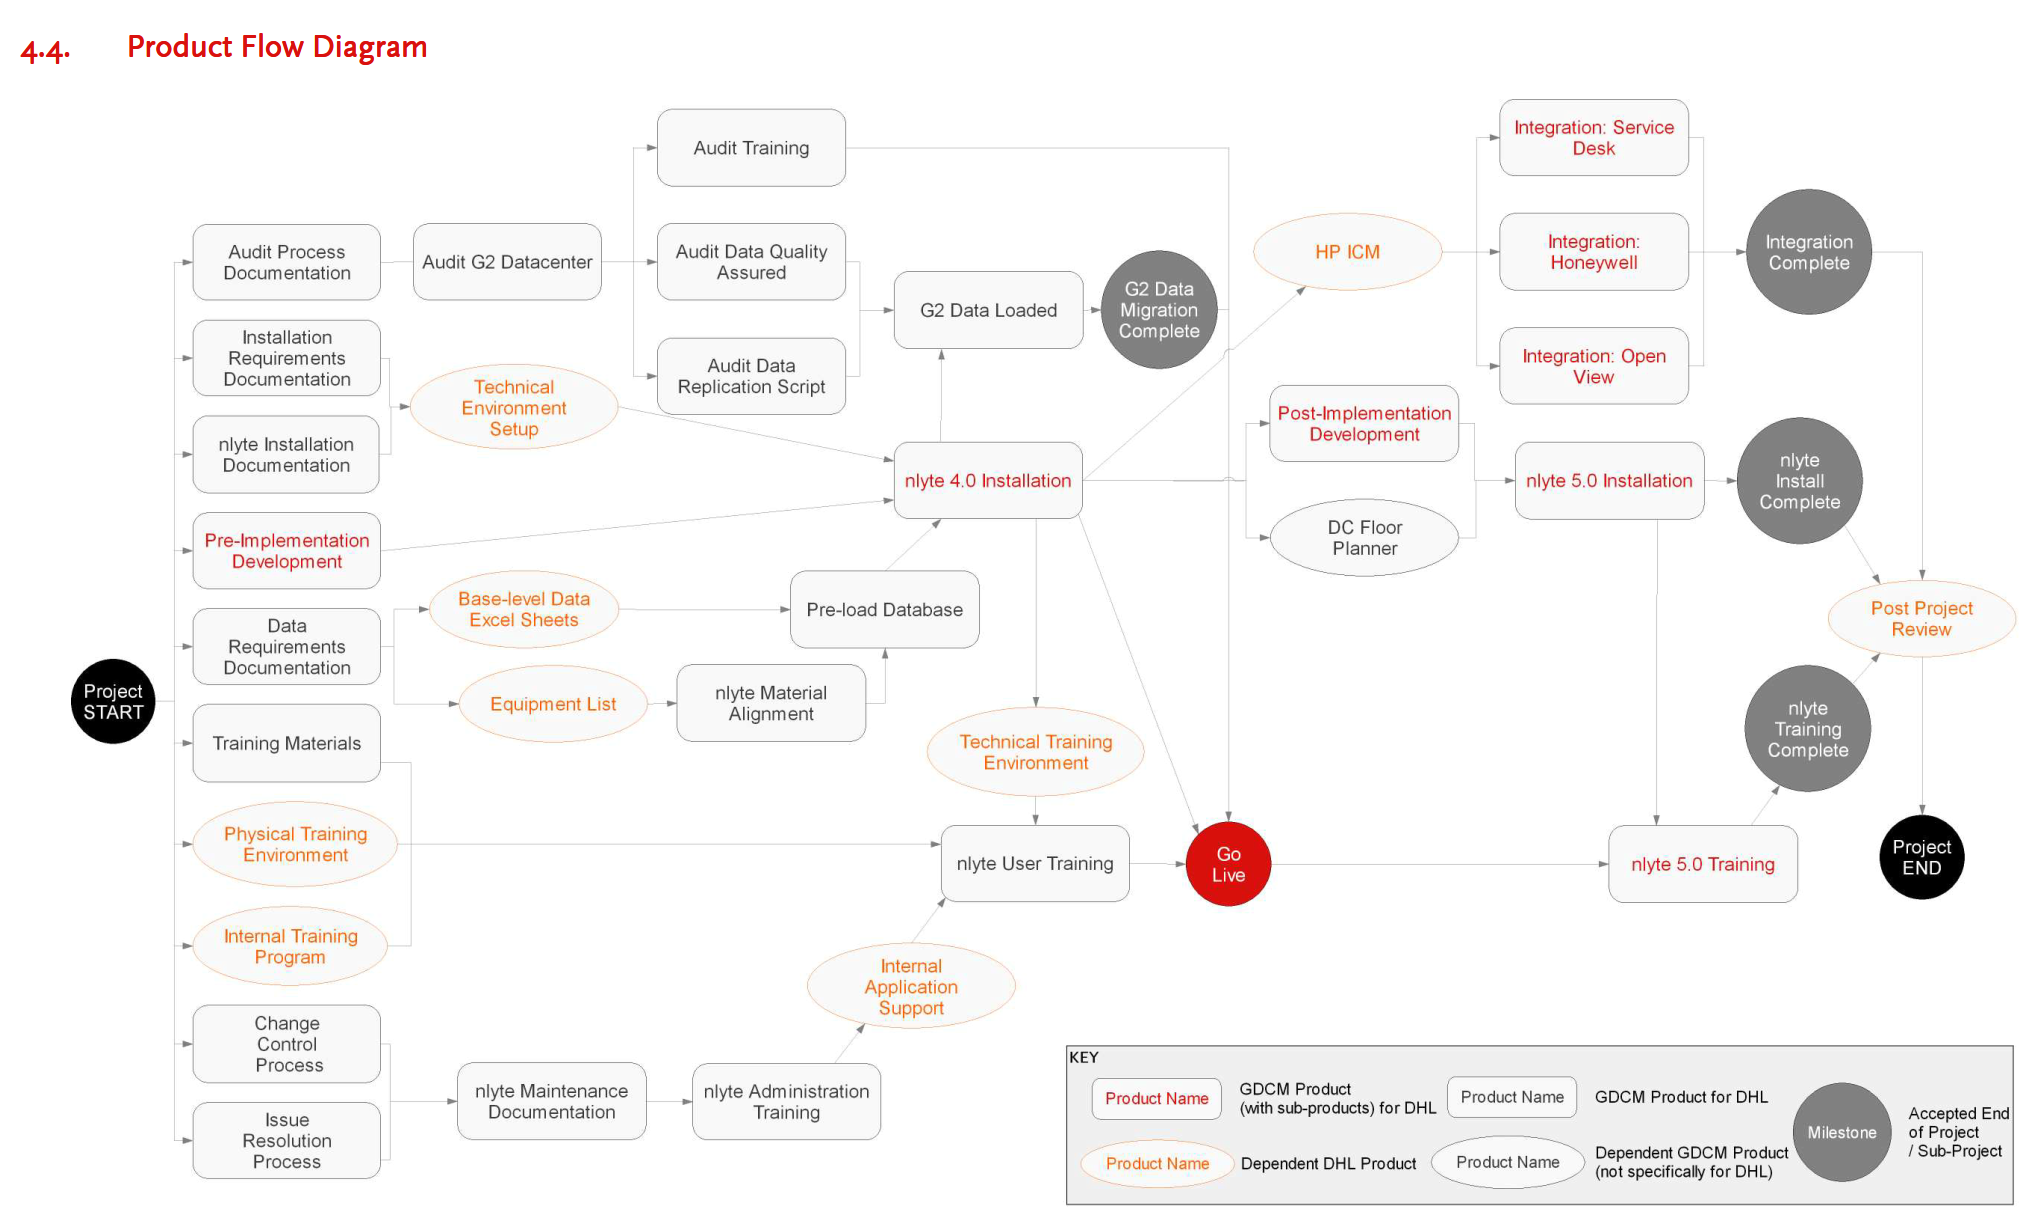
A key and highly relevant strength of PRINCE2 is its focus of product-based planning (as opposed to planning based on tasks). This is even more relevant now - in the age of Micro-services, mobile apps, and long-running Agile Roadmaps.
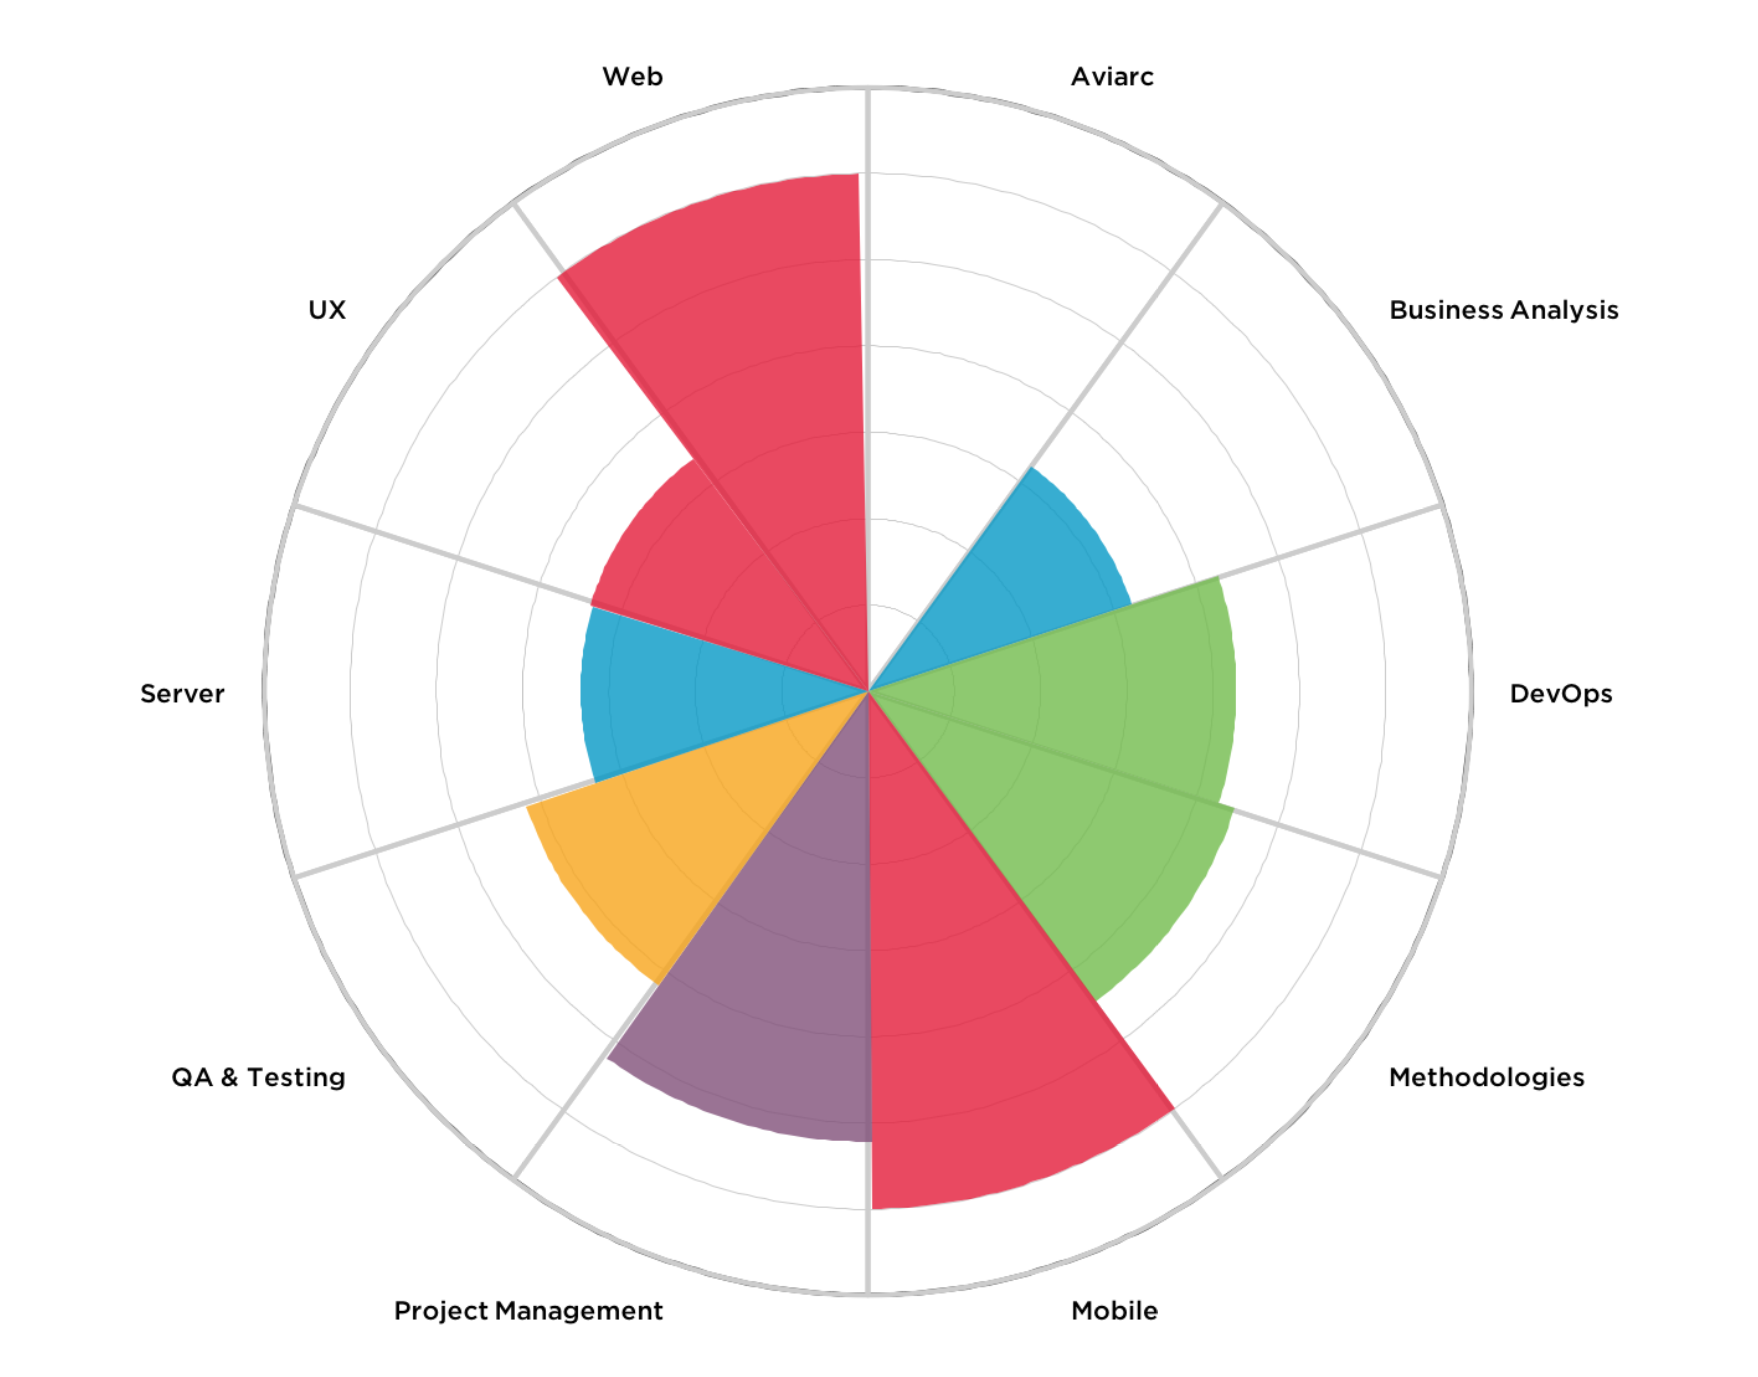
Professional Development
It can be challenging to manage professional development well in multi-functional teams where many team members have overlapping skills and different profession interests. This can be further complicated if there is market-pressure to align towards certain strengths.
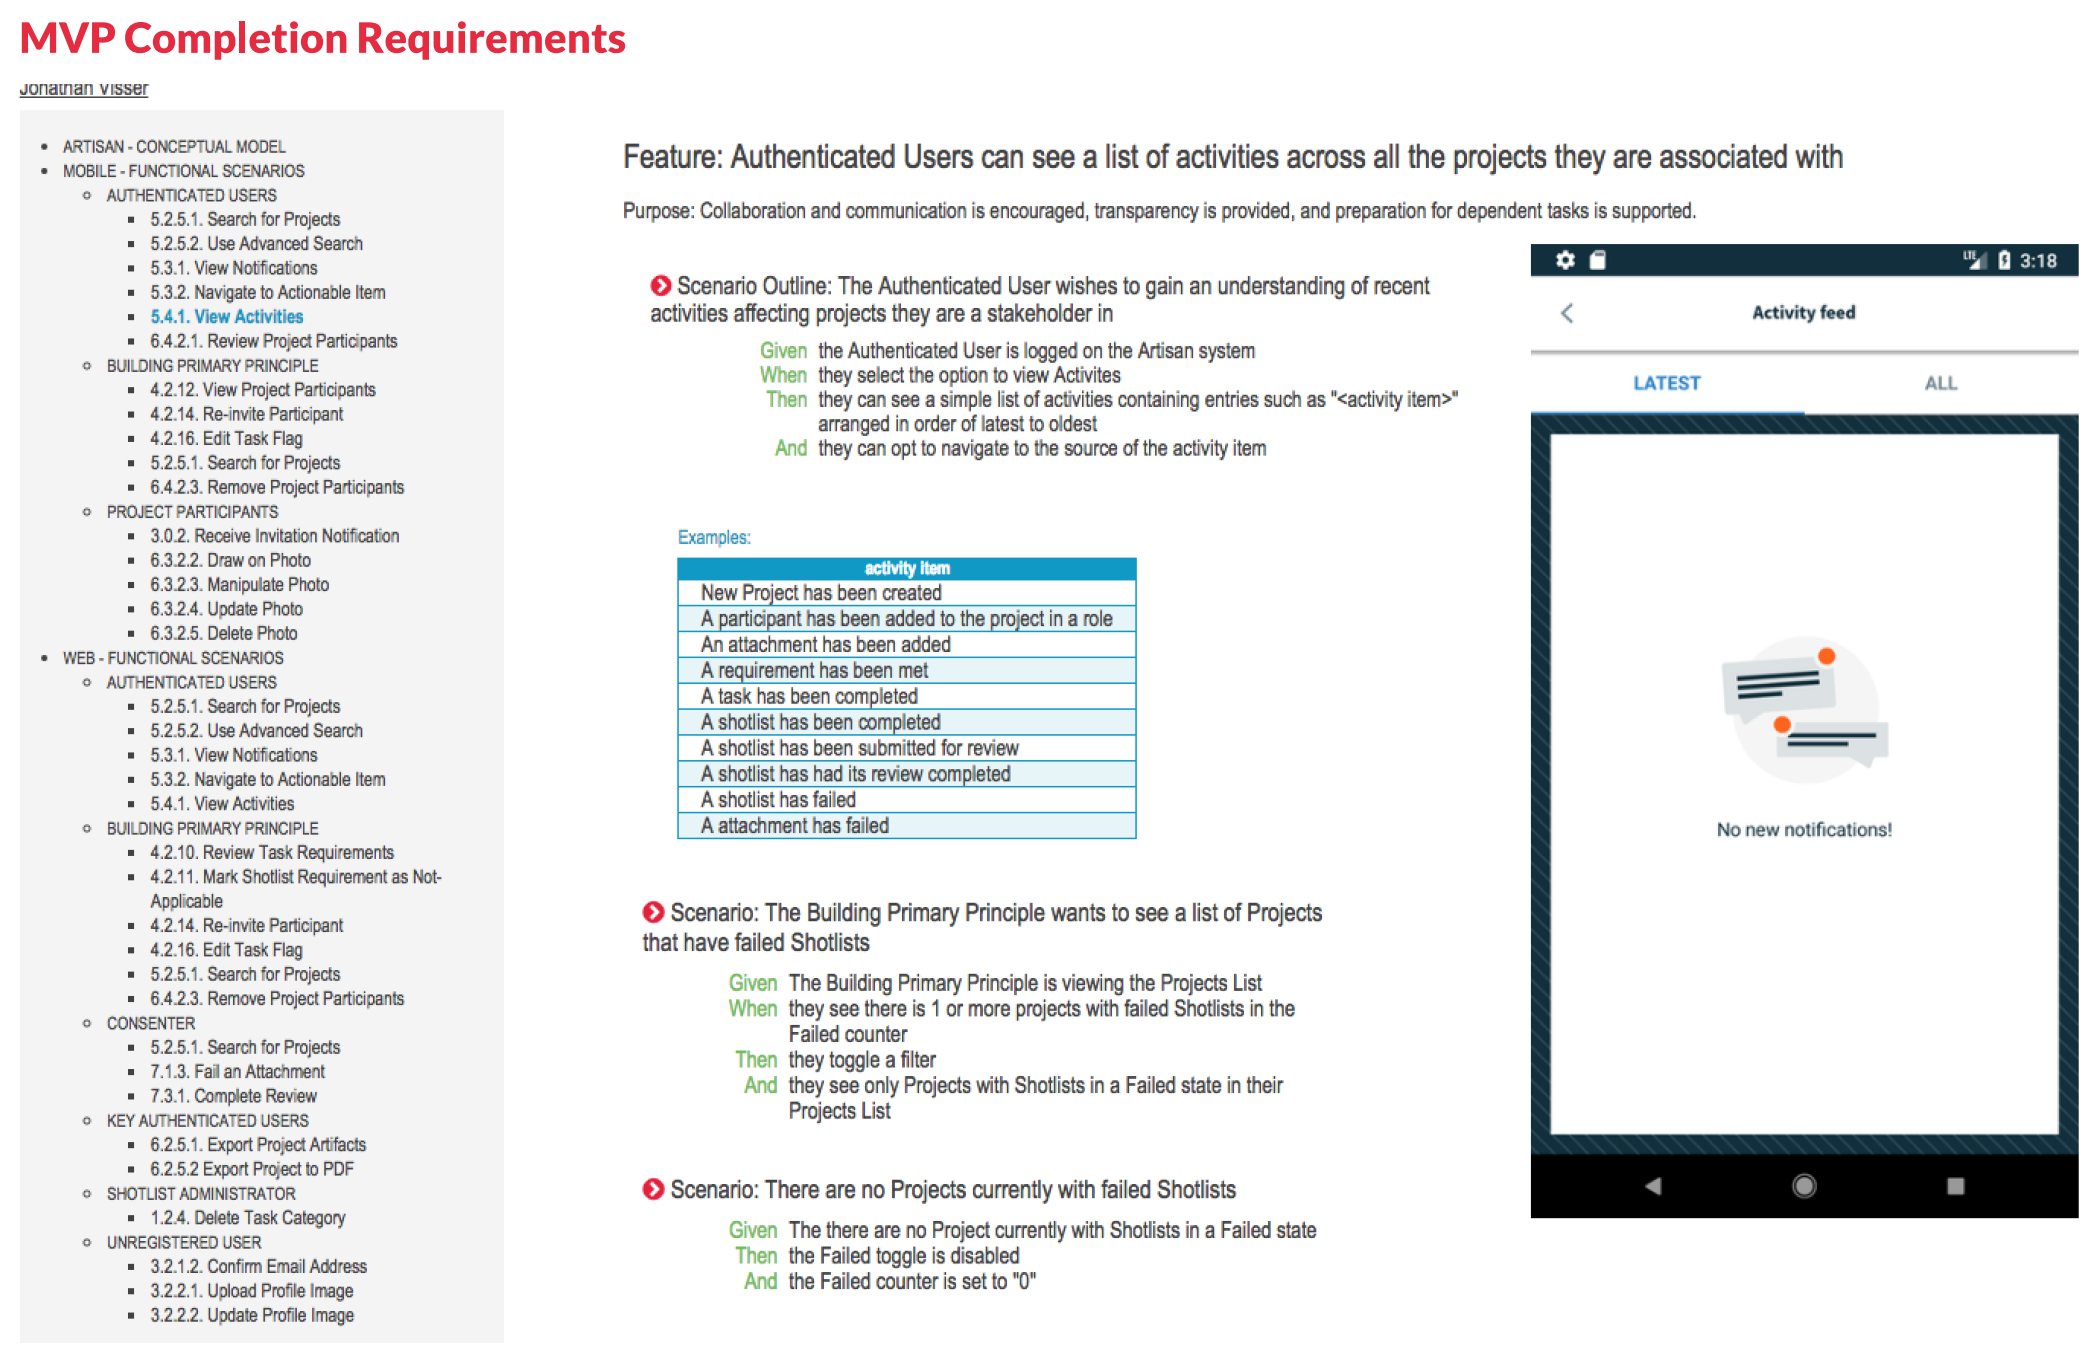
Requirements Specification
Once the User Stories have been identified, it’s time to flesh-out the business rules. Cucumber/Gherkin is a great requirements specification standard to use. It’s business-user friendly, well-structured and consistent, and leads directly to automated testing.
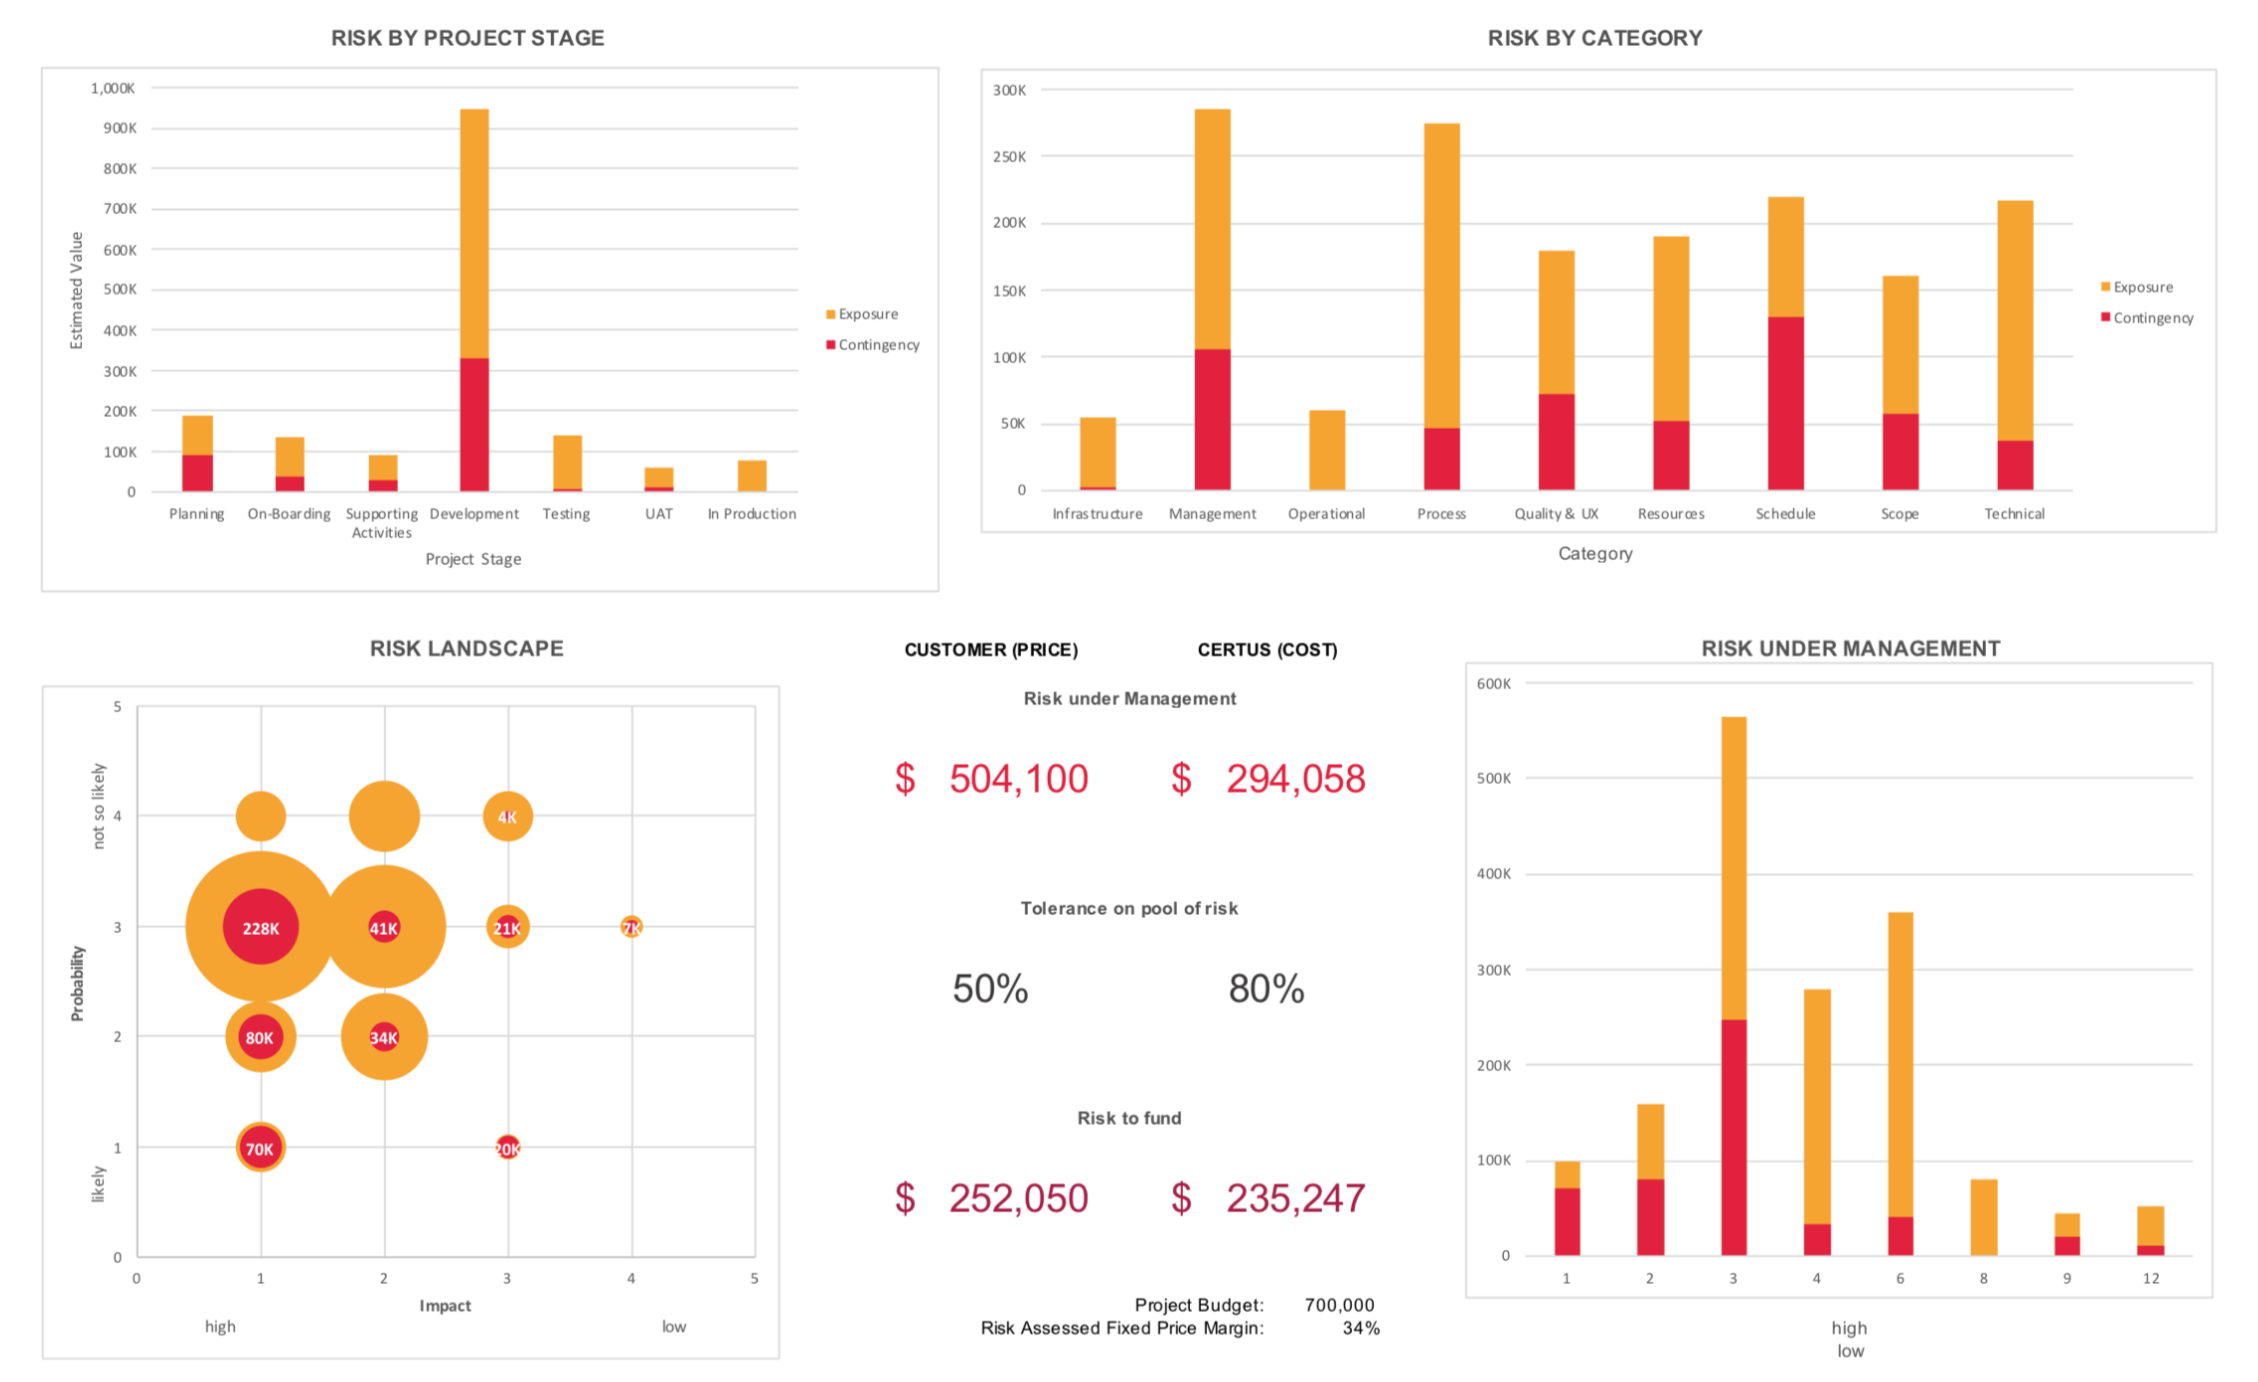
Risk Analysis
This risk analysis report was created by detailed review of a risk log - sizing/pricing potential impact both before and after identified countermeasures had been applied. Each risk was further categorised and tagged to help improve risk management.
This made project risks clear, actionable, and helped establish a fair basis for any fixed-price negotiations.
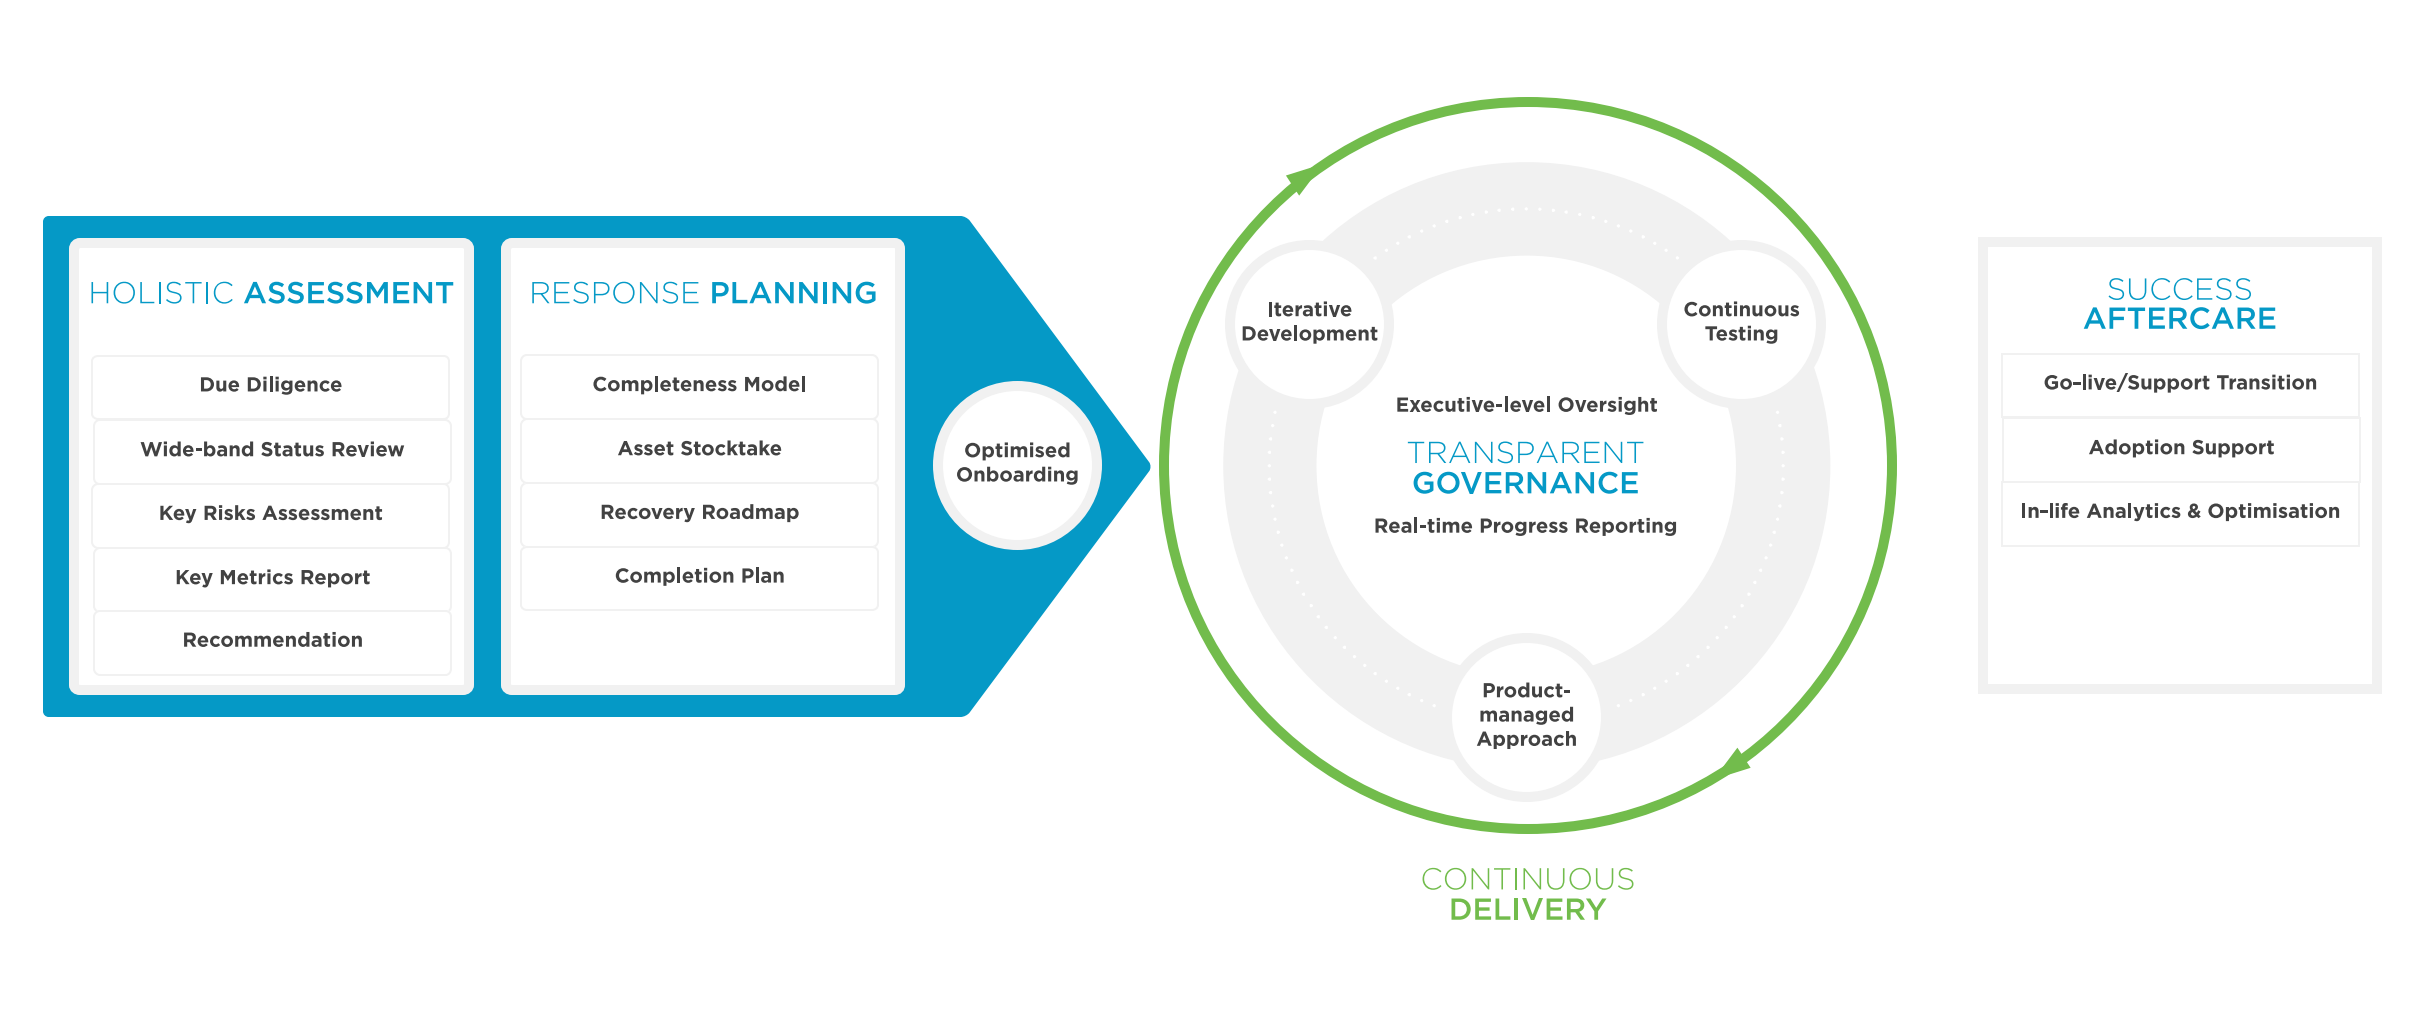
Service Productisation
It’s important to make things easy and repeatable. As I helped a customer with a tricky situation, I realised I had assembled a solid approach - with a set of related techniques - that could help others. I packaged it into a methodology and produced supporting collateral.
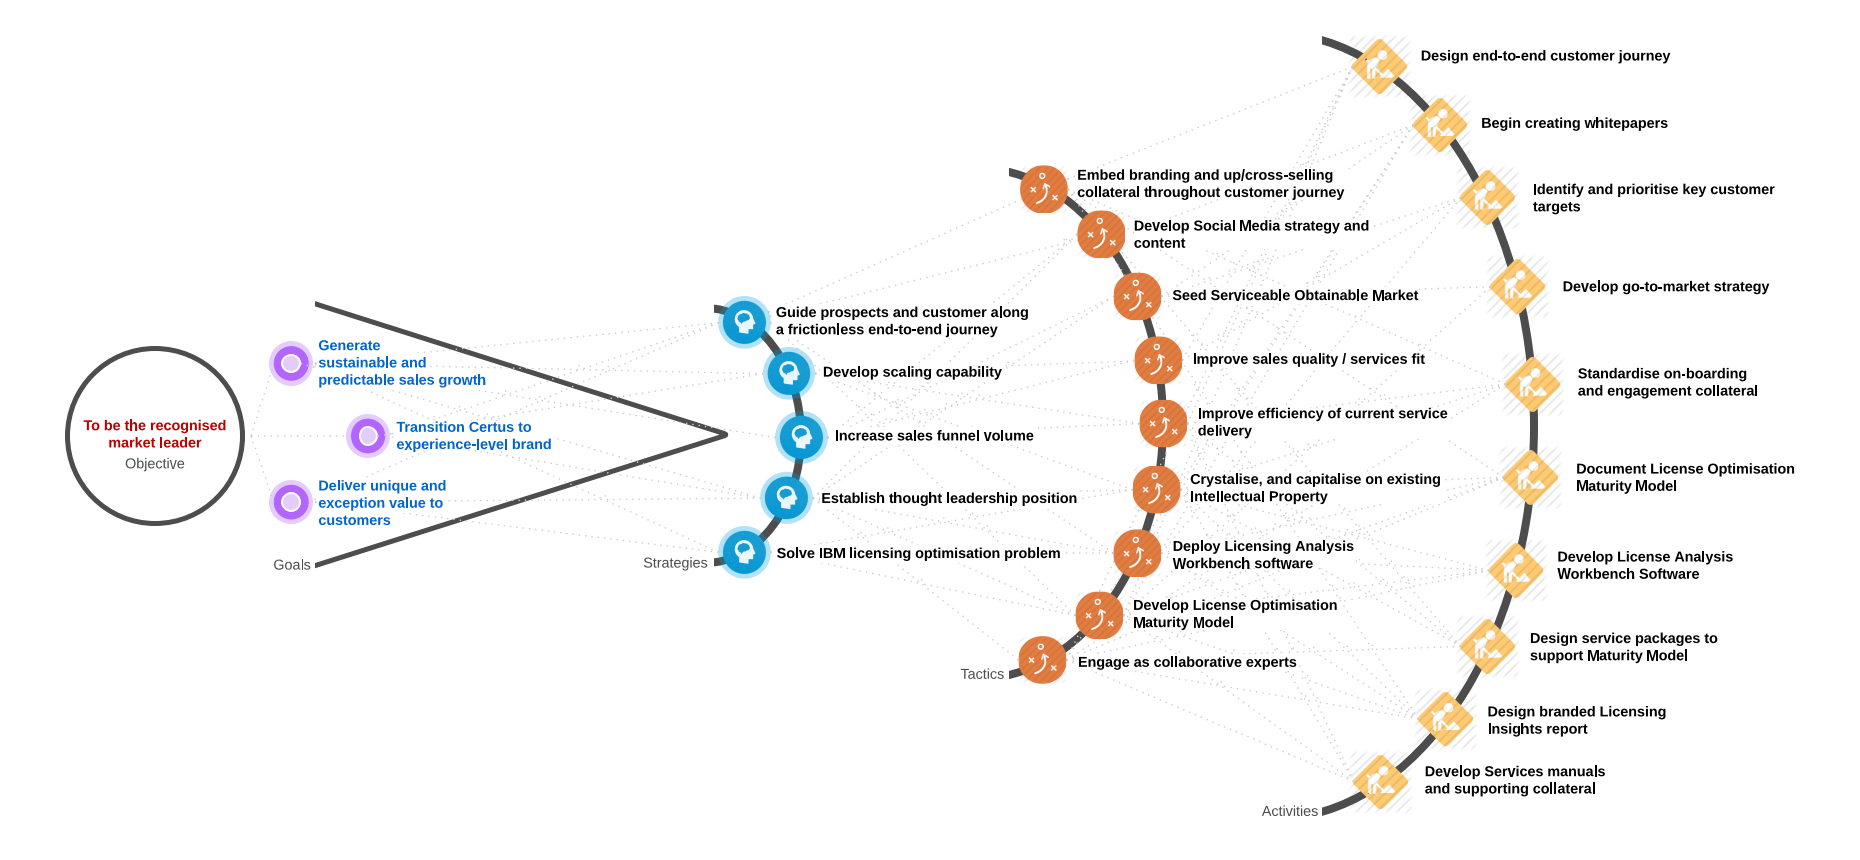
Strategic Planning
To be actionable, a strategy has to be clear and connected to activities. In practice, the connection goes both ways; frequently intuition and experience has already identified key activities and tactics. And it’s useful to connect these to their upstream “why”. This creates alignment.
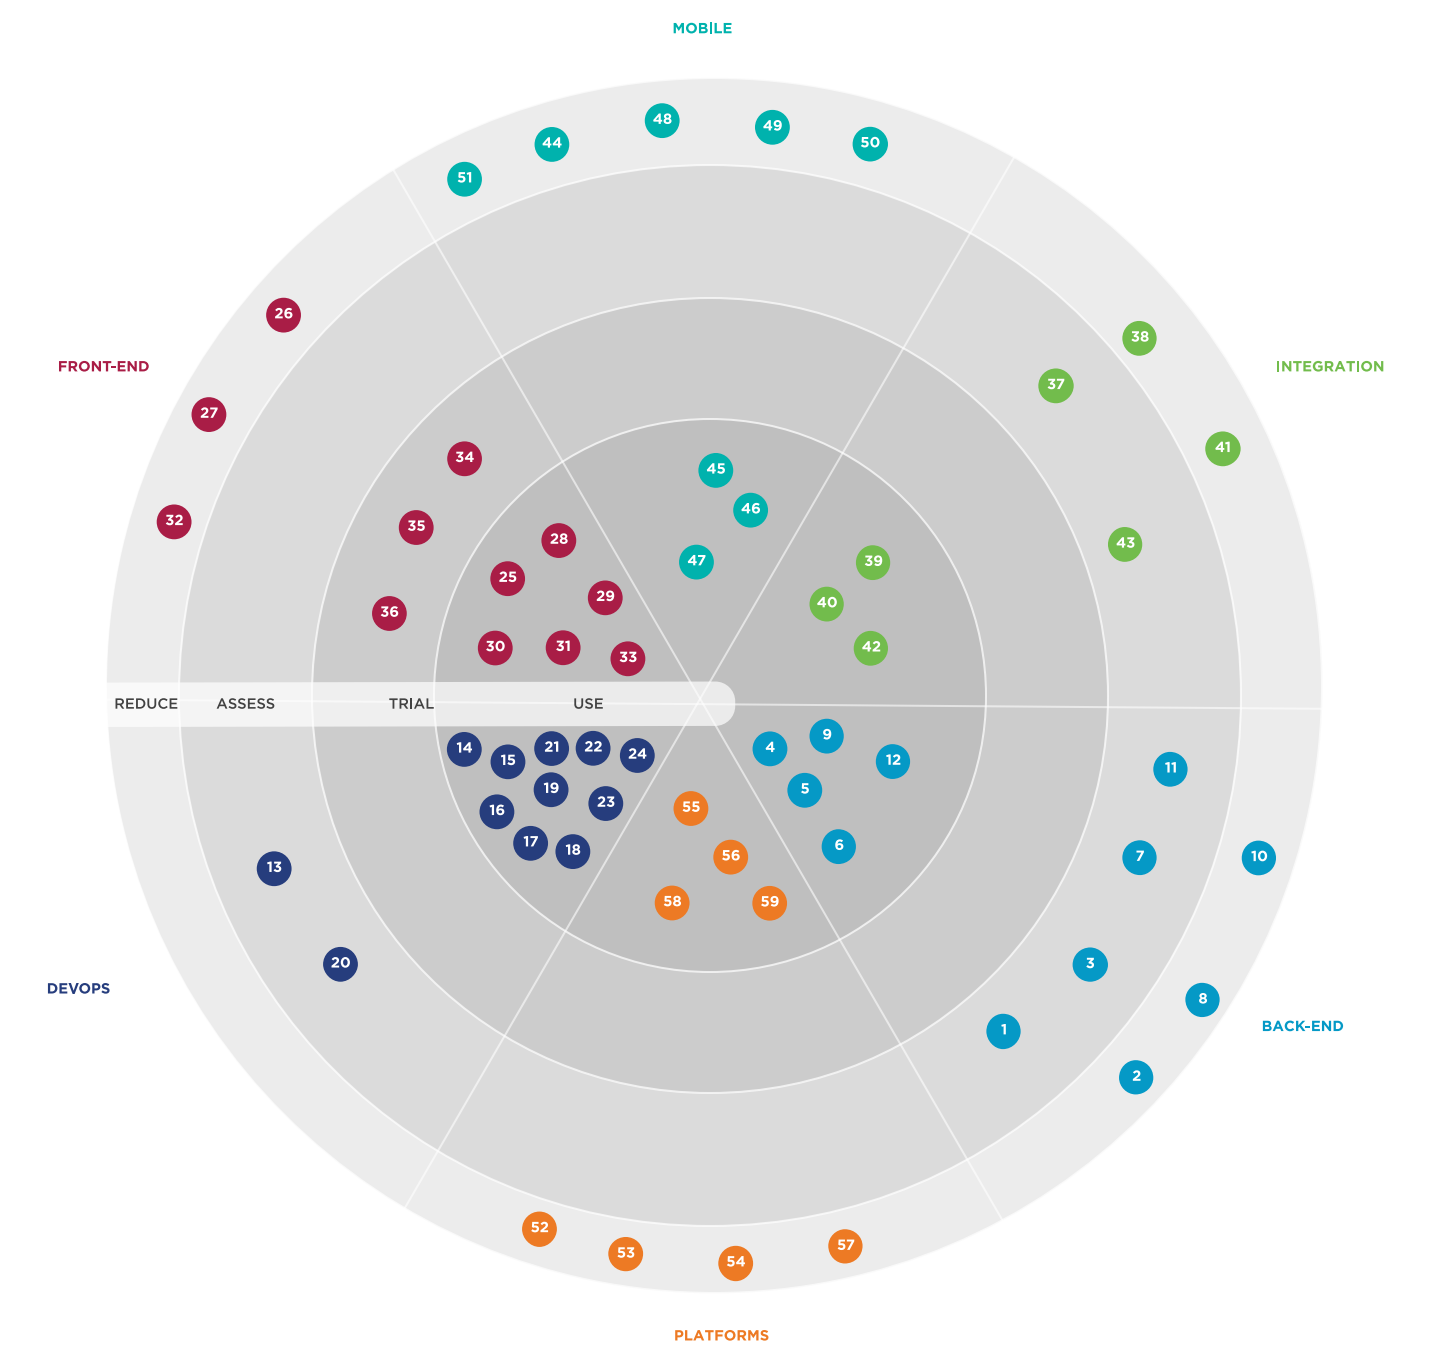
Tech Radar
Today, there is a lot of technology. A complex world, at once diverse/overlapping and fragmented/integrated. ThoughtWorks have a great tool, they call their “TechRadar”. Here, I’ve used this tool and tailored it for a specific development team.
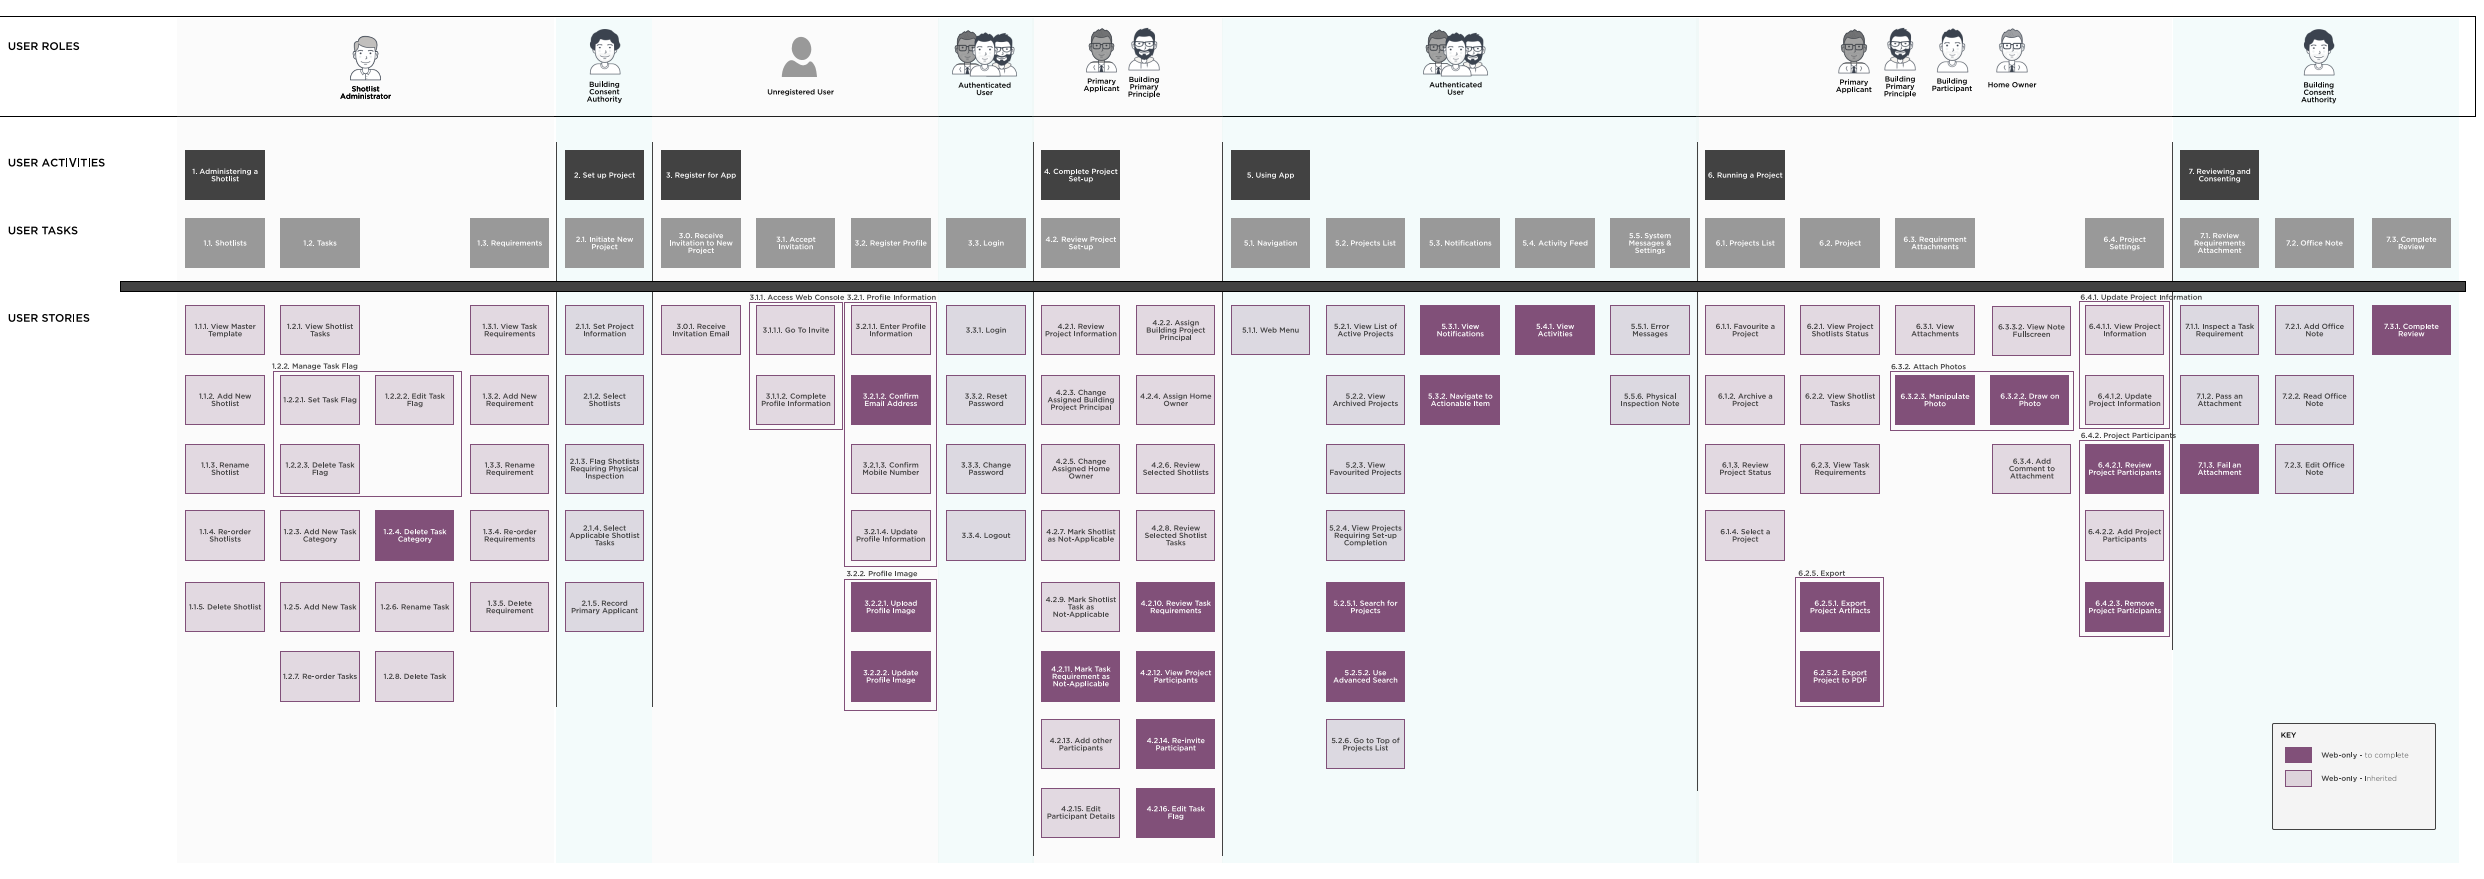
User Story Mapping
User story mapping is an essential Agile requirements management technique. It builds a hierarchical behavioural model of the software, and outlines the essential business process flow by user role.
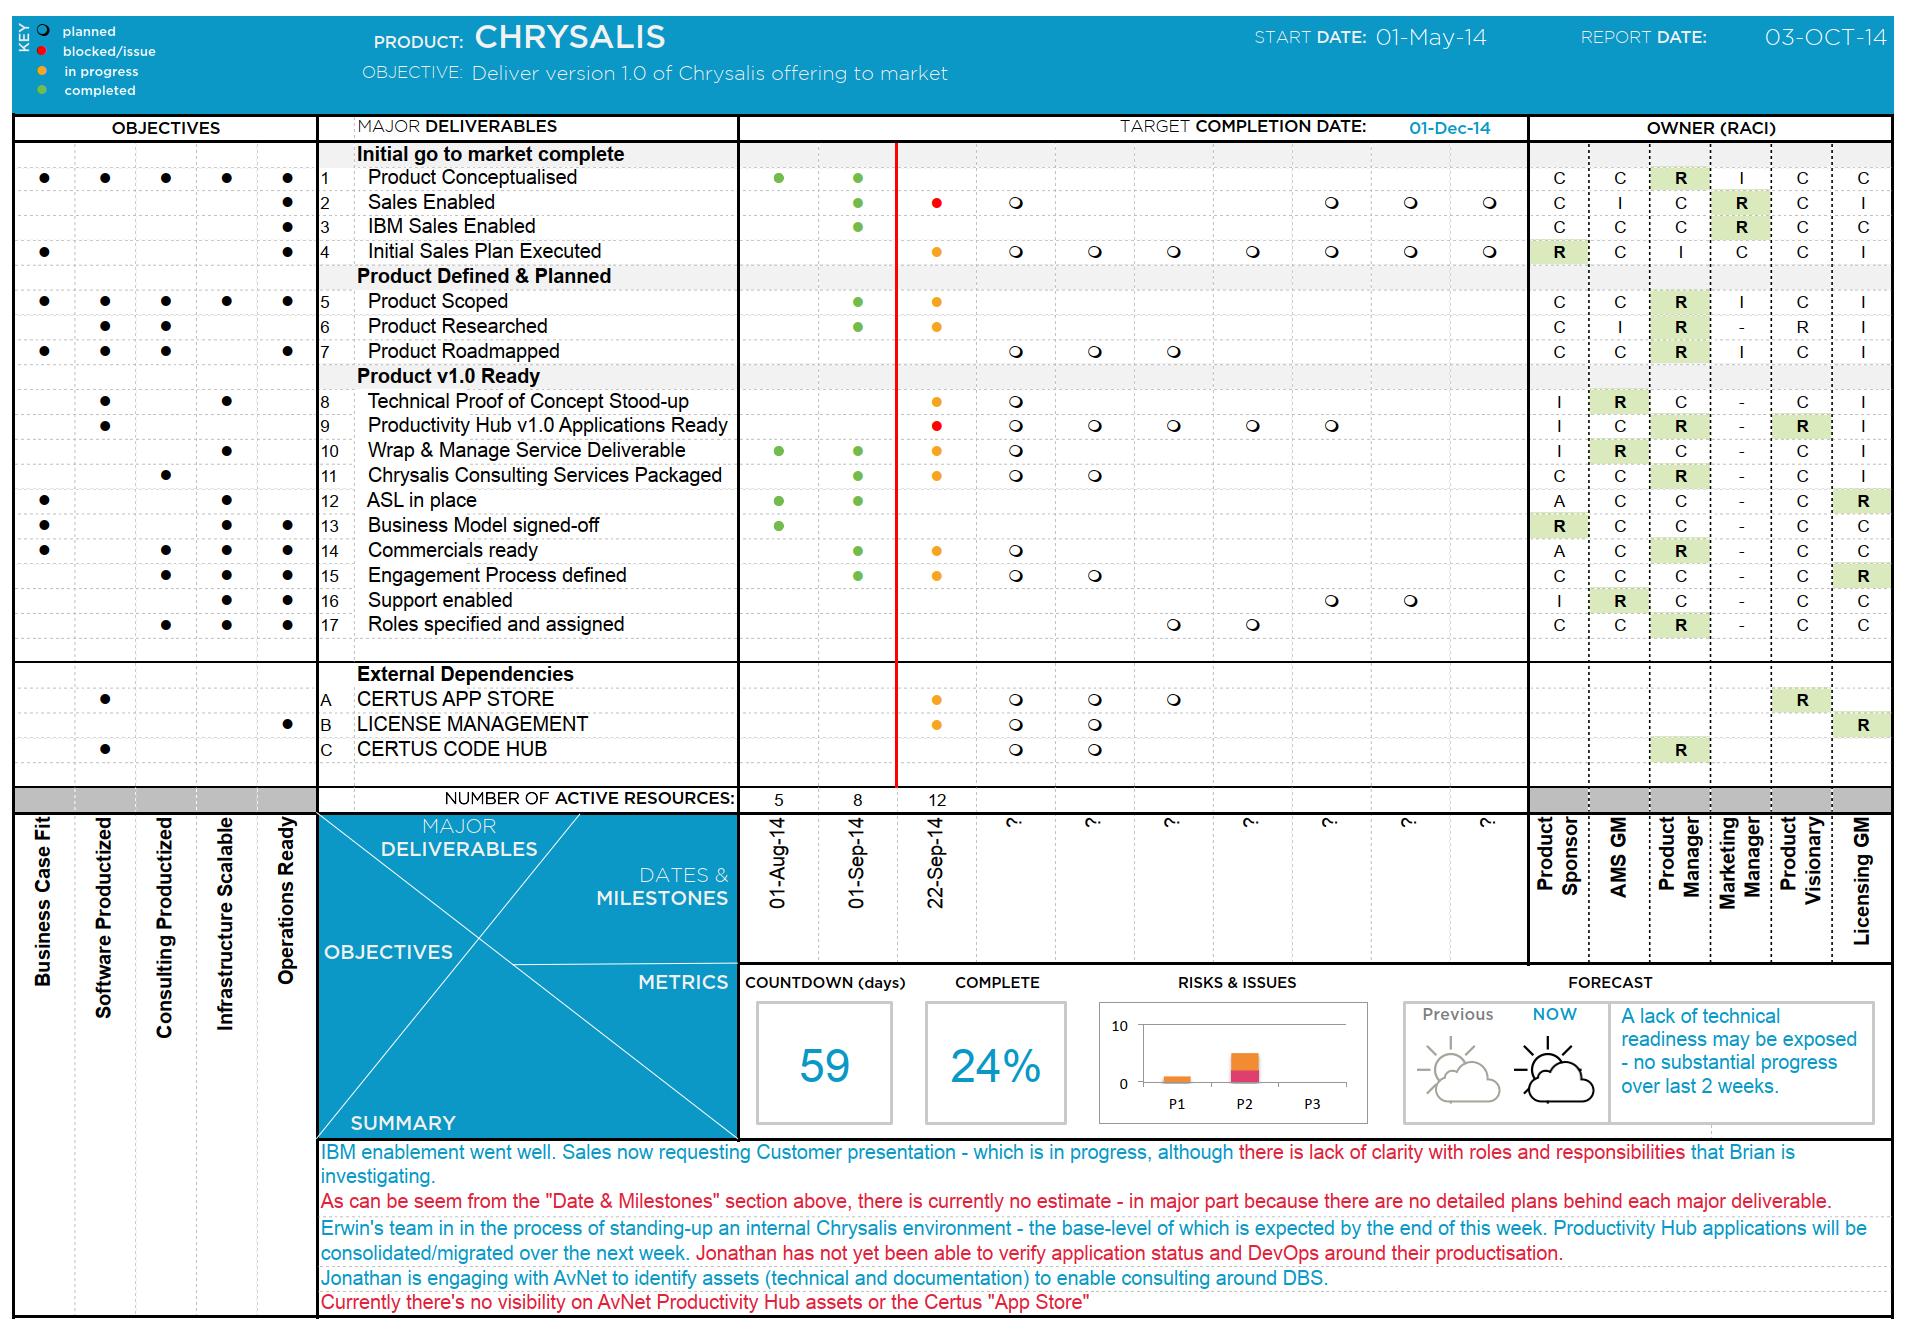
Project Delivery Planning
I love tools that are simple yet powerful. Here is a one-page project plan that doubles as a living report.
Concept Development
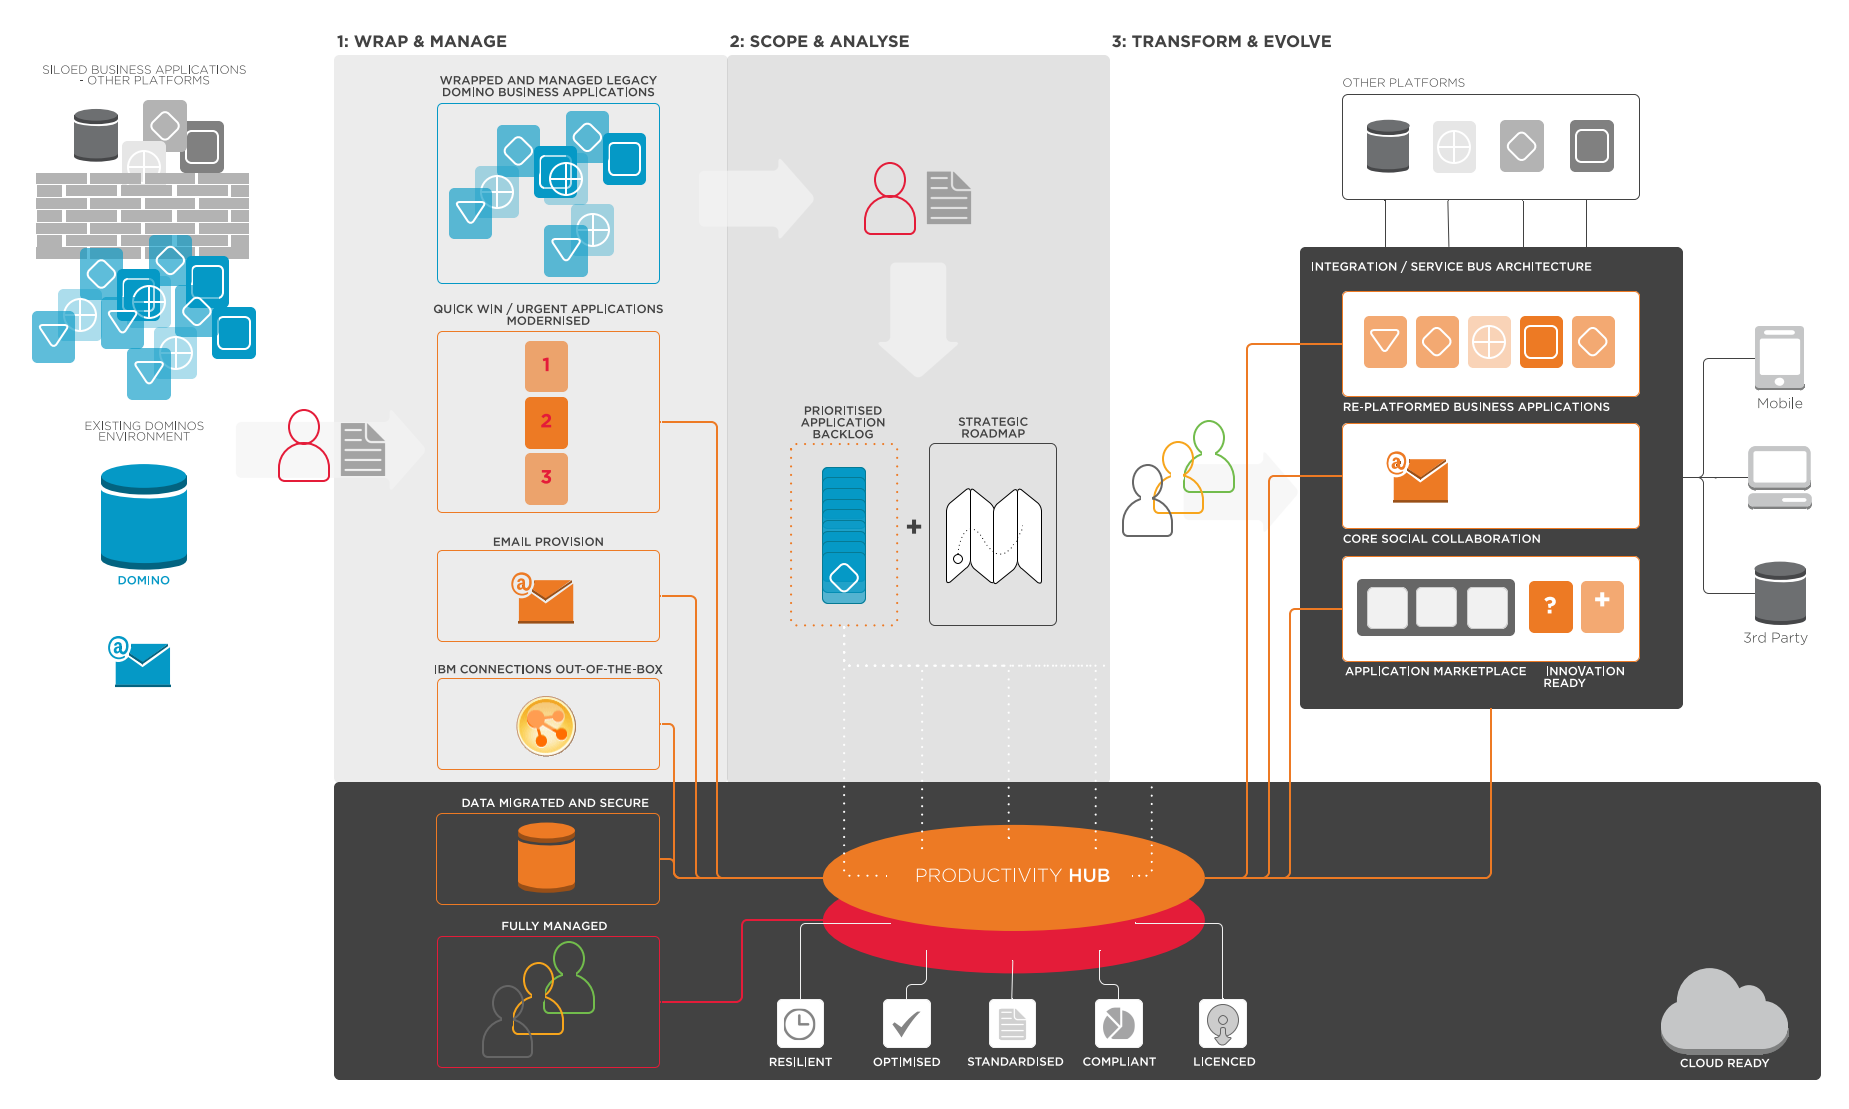
All products start with an idea. If that idea can be captured in a way that’s tangible and clear, the concept can be improved, collaborated on, and momentum can be built.
Process Documentation
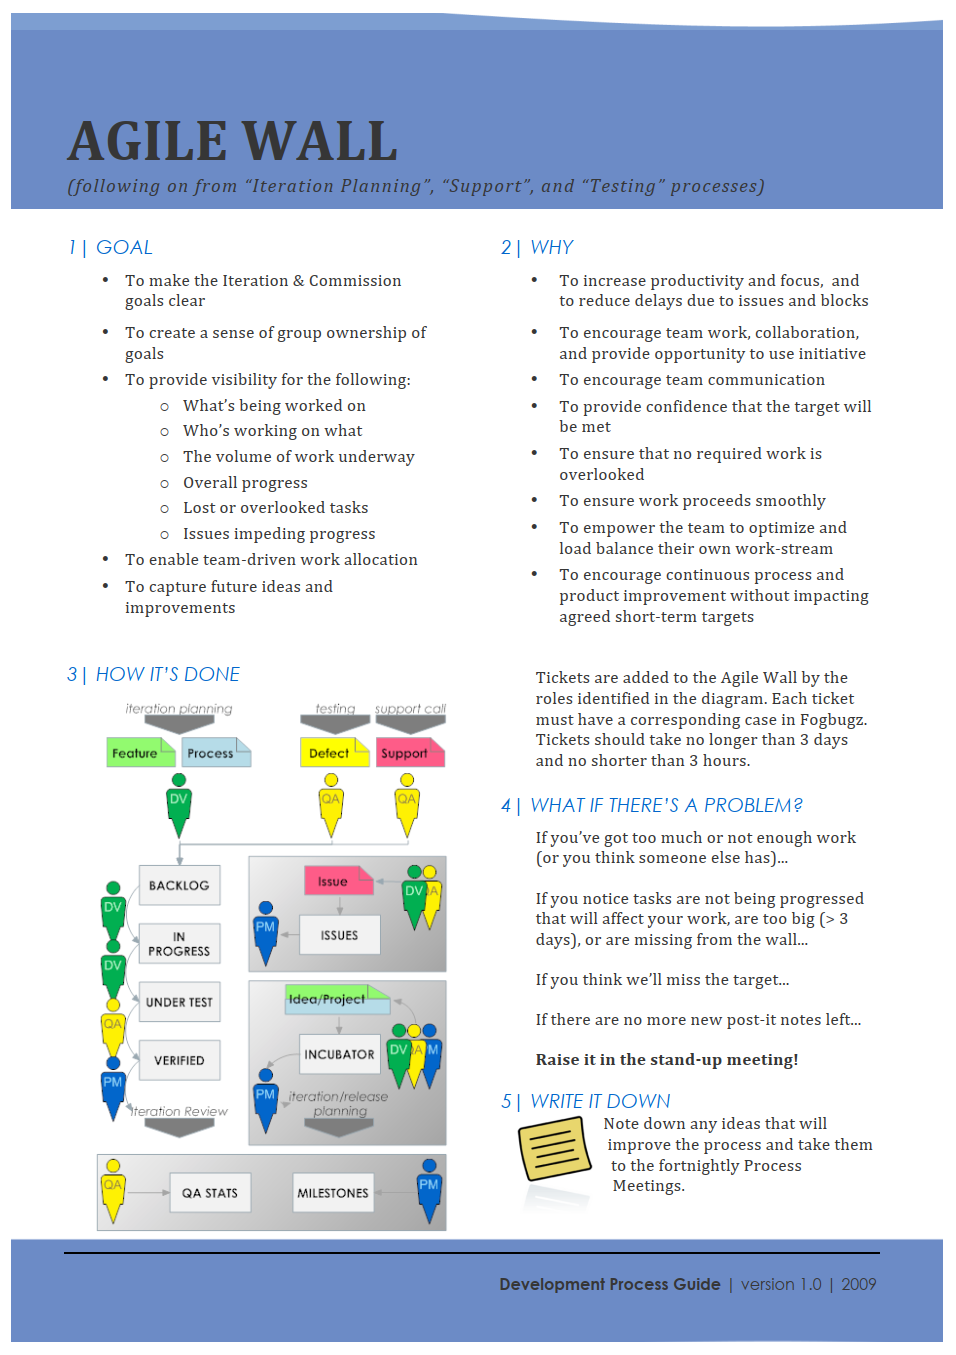
For some teams Agile is still a new concept. Frequently people are coming together with a mixture of experiences and ideas. Some teams might need or want to grow their own unique spin on Agile.
UI Wireframing
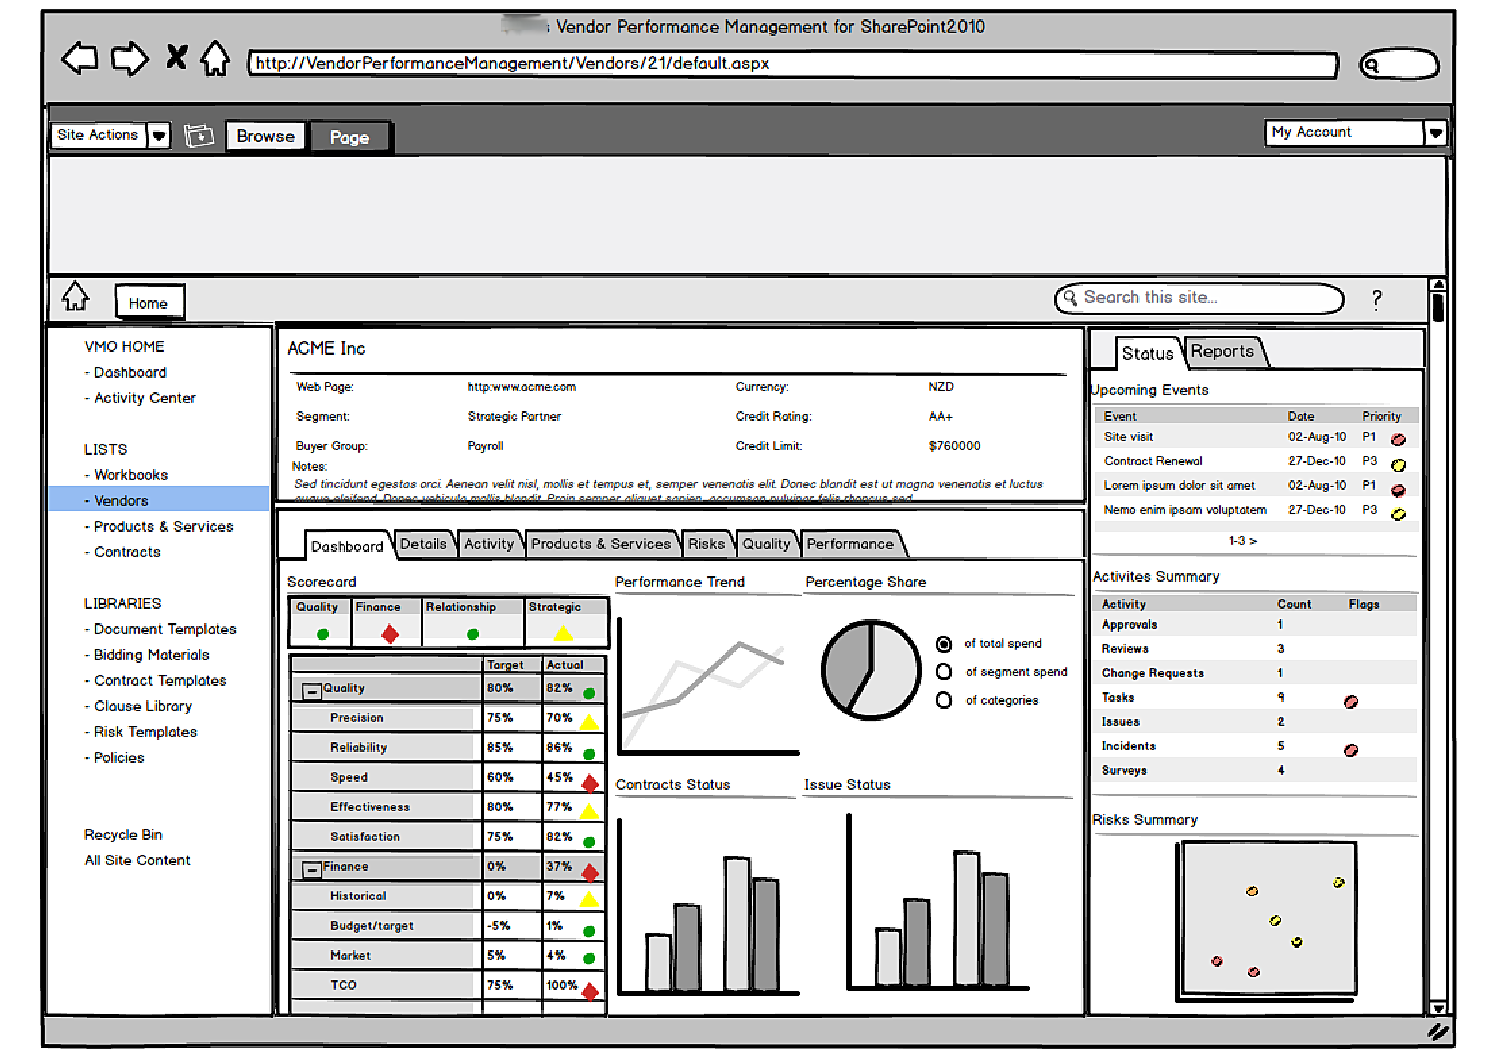
There are various ways to generate rapid UI prototypes. Sometimes a whiteboard diagram is all that’s required - once digitised and embedded in a document, it can be perfect for validating requirements and core business flows.
An intermediate approach - short of producing an HTML mock-up or engaging a designer - is to use a diagramming tool to put together a wireframe. This is an excellent way to really think through the scope and requirements.
Engagement Planning
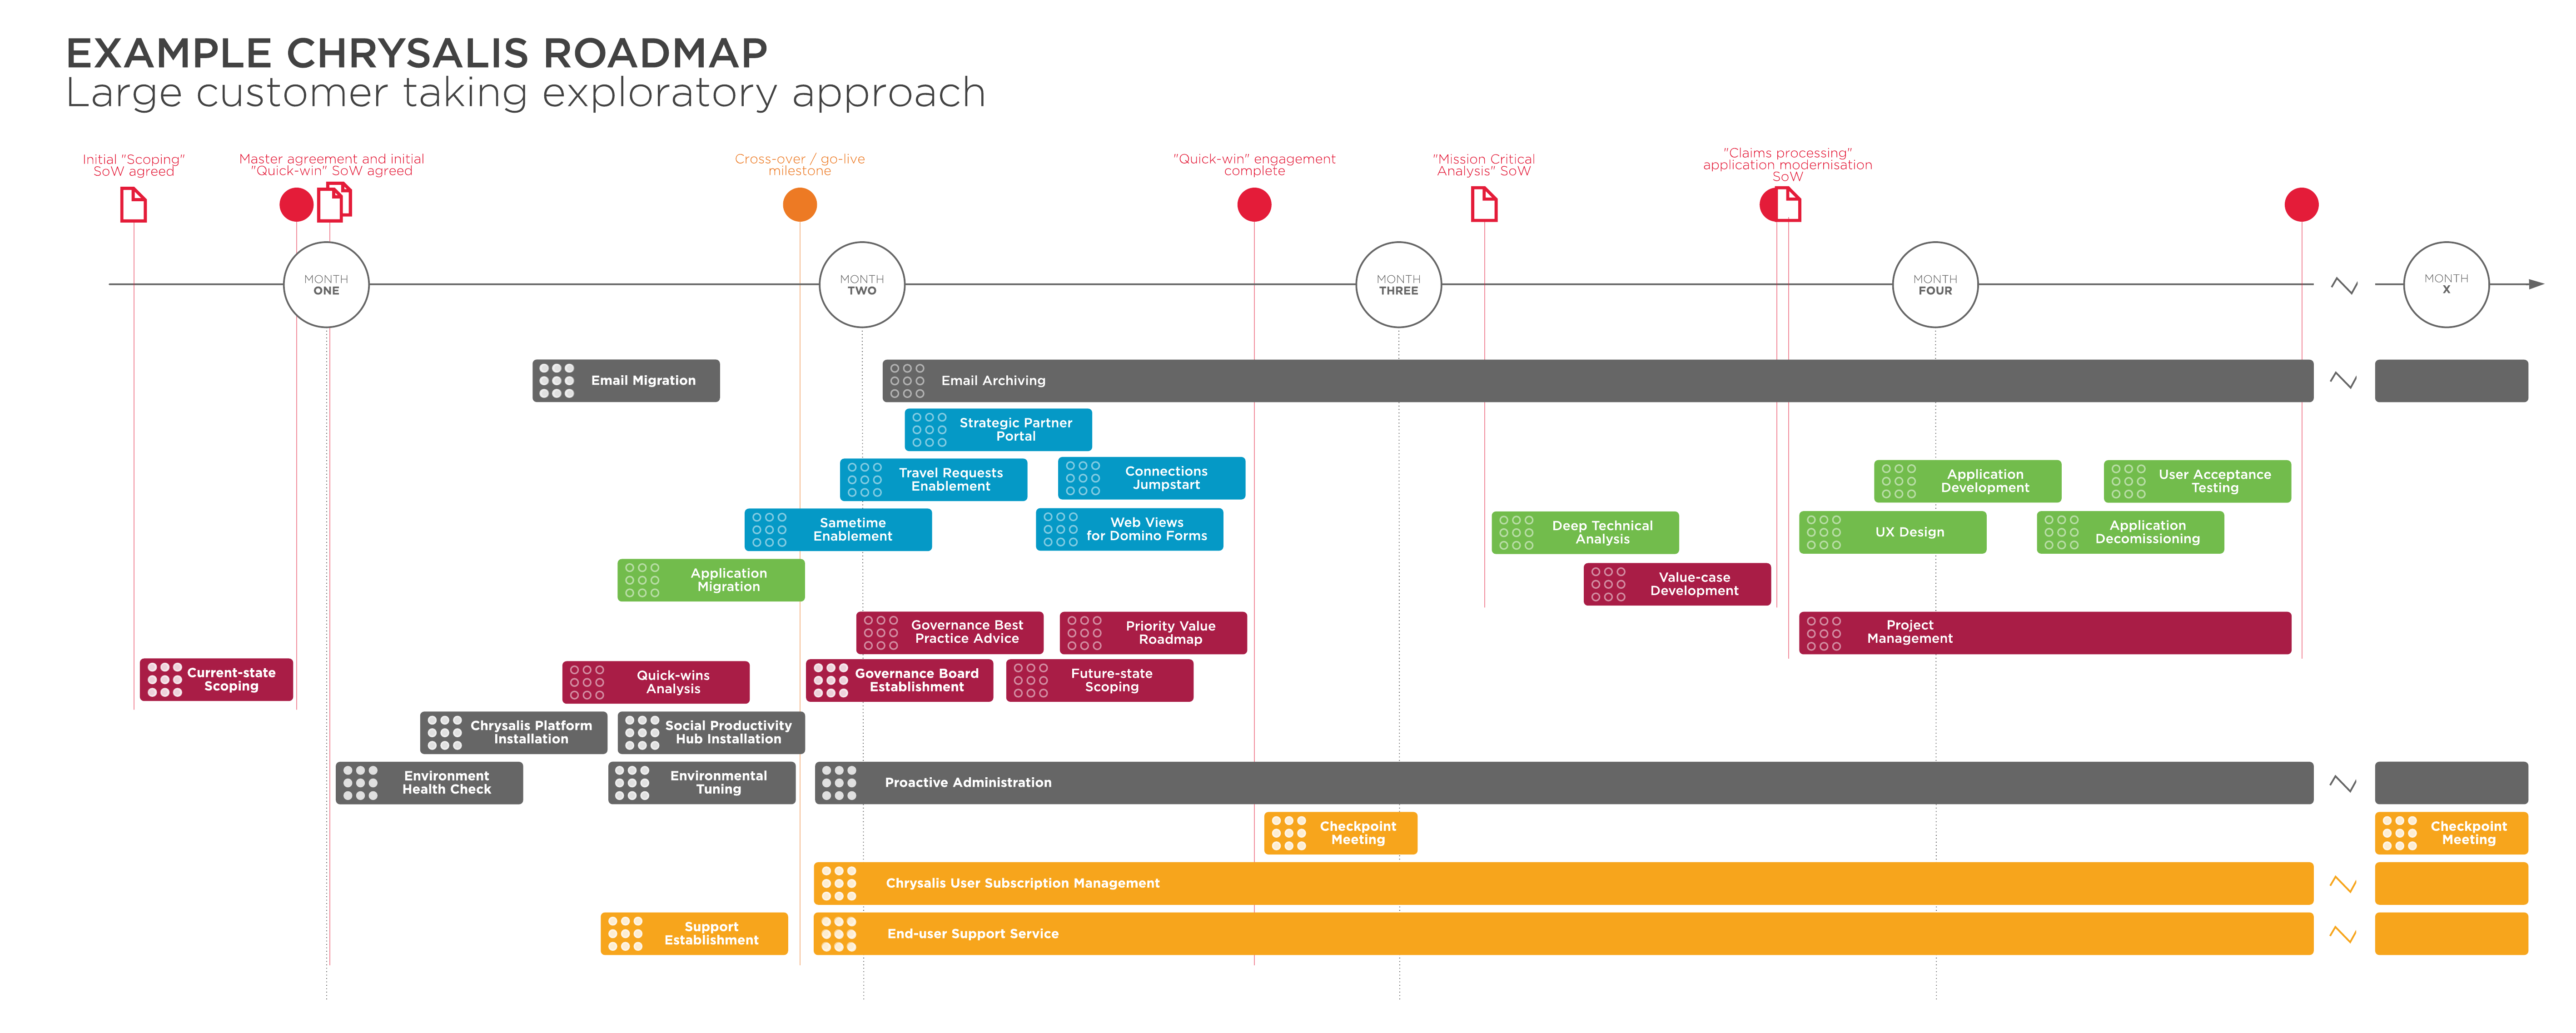
This is a multi-streamed Gantt chart that illustrates how a major digital transformation project might run.
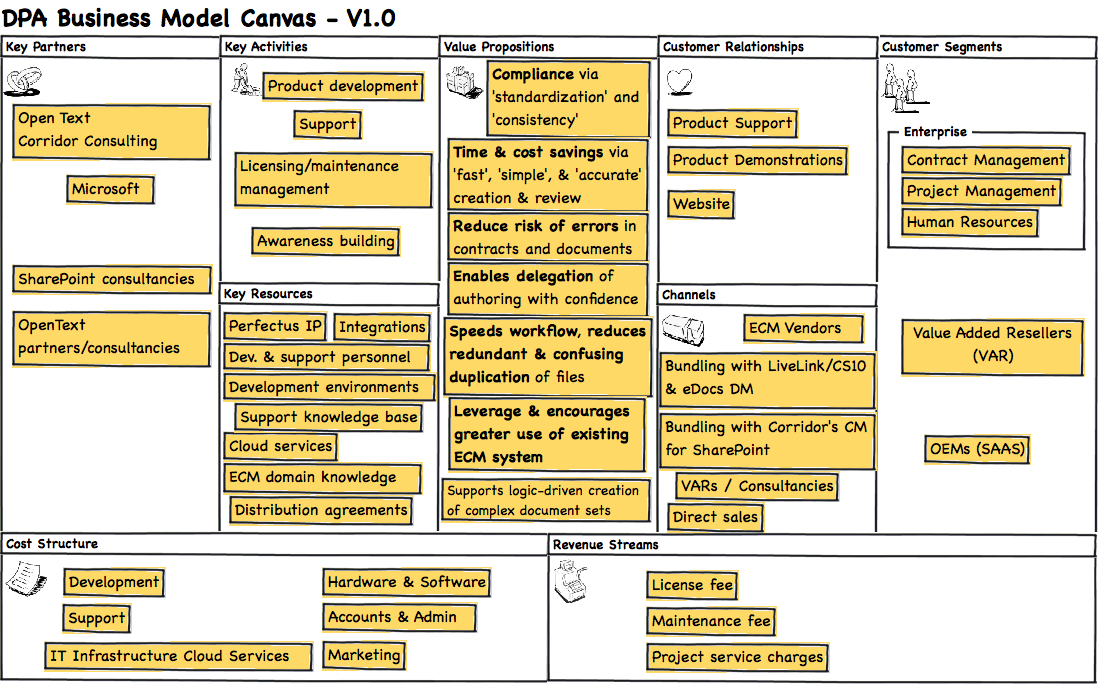
Business Model Canvas
The business model canvas is a great way to distill and communicate the essence of a business or product. It’s a way to make simple statements that lead to interesting questions.

Rapid Prototyping
Sometimes it’s helpful to see wireframes brought to life. Here’s a simple example of a services shopping-basket experience.
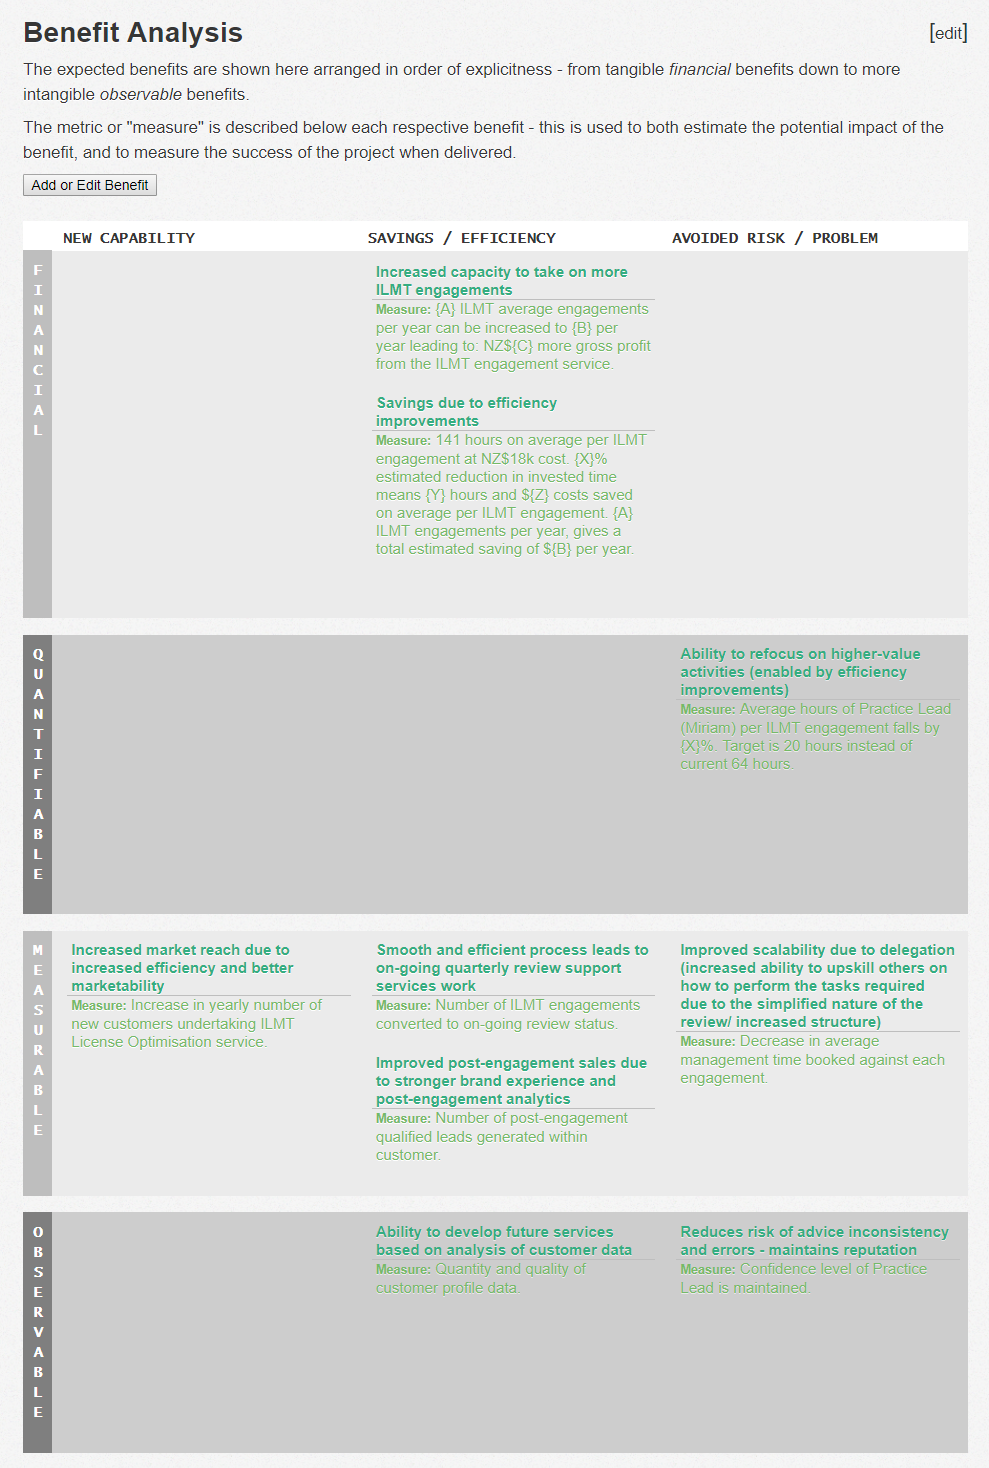
Benefits Analysis
Here is an example of best-practice benefits modeling. Each benefit is placed on a matrix - positioned according to how tangible it is, and what type of impact it has.
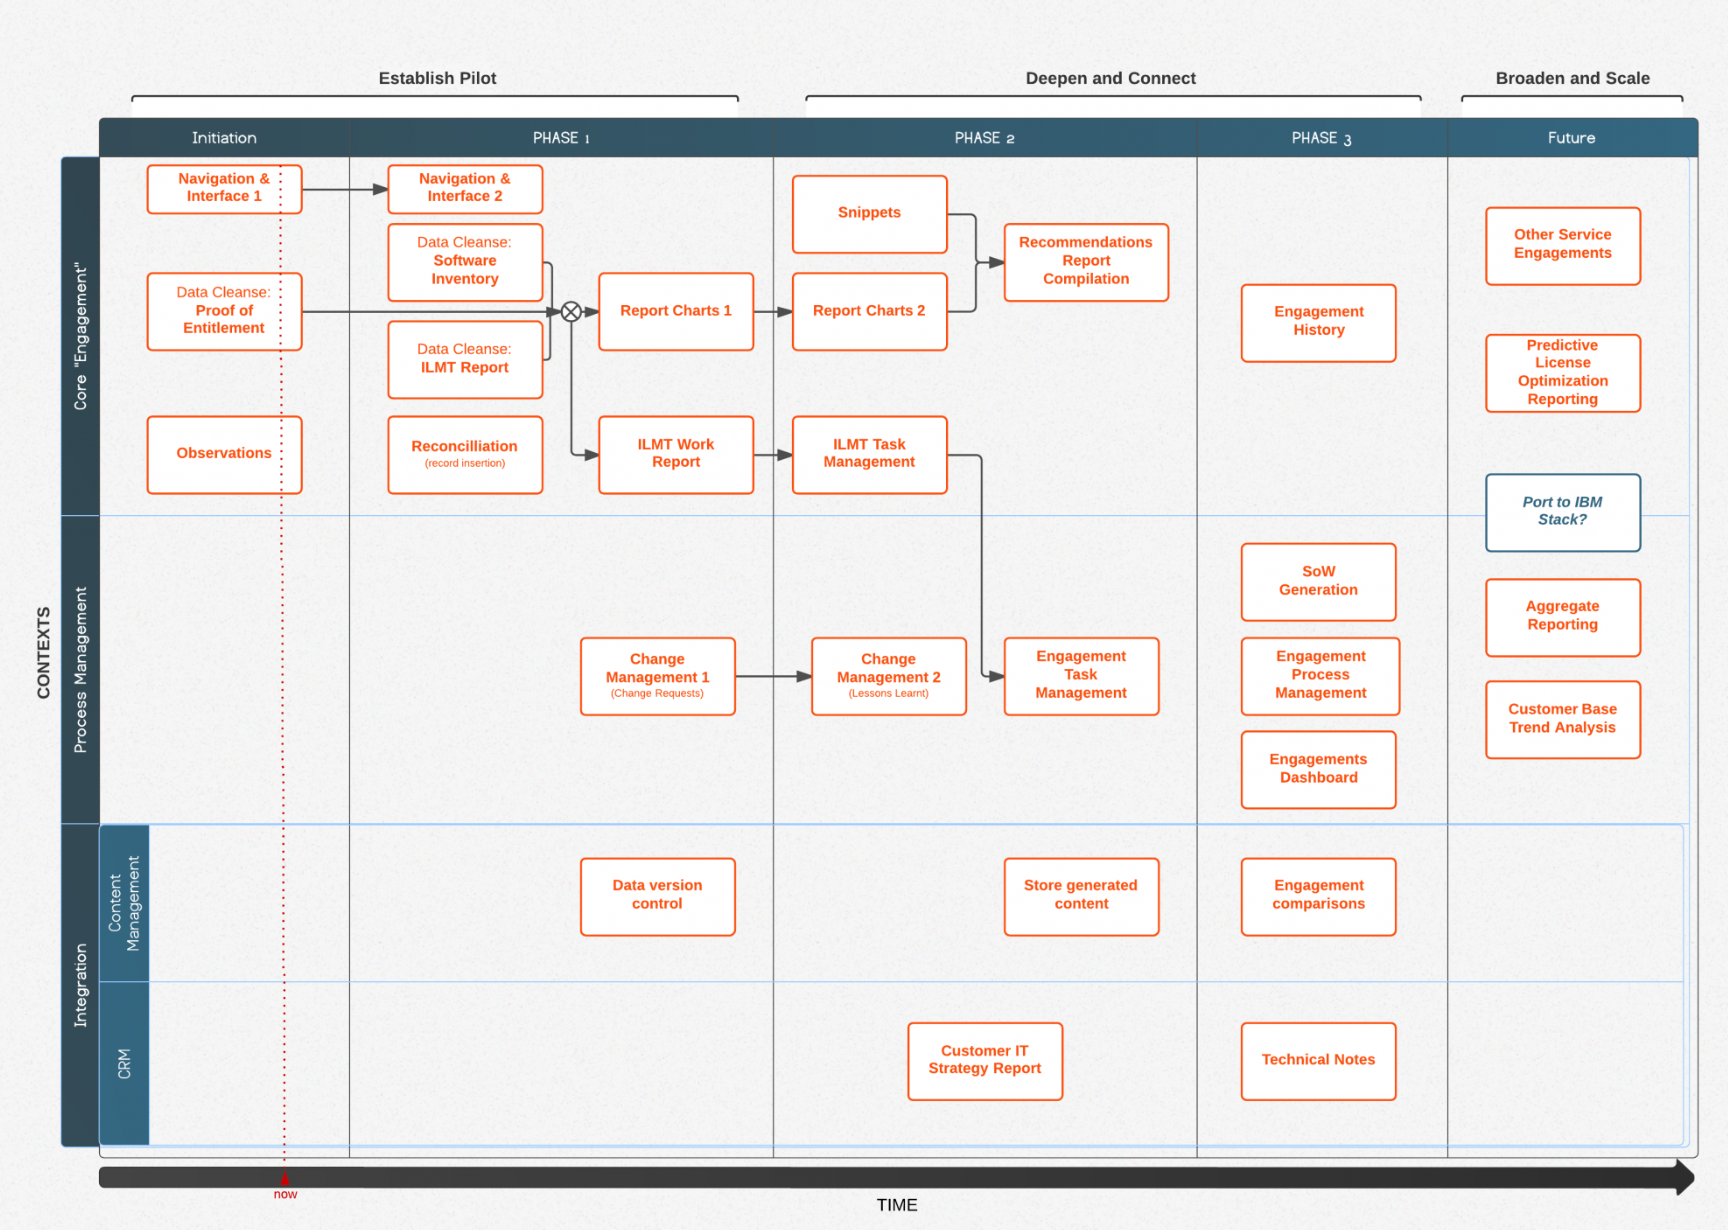
MVP Roadmap
A detailed product implementation roadmap involves careful and optimal sequencing - balancing technical dependencies with business and operational priorities.
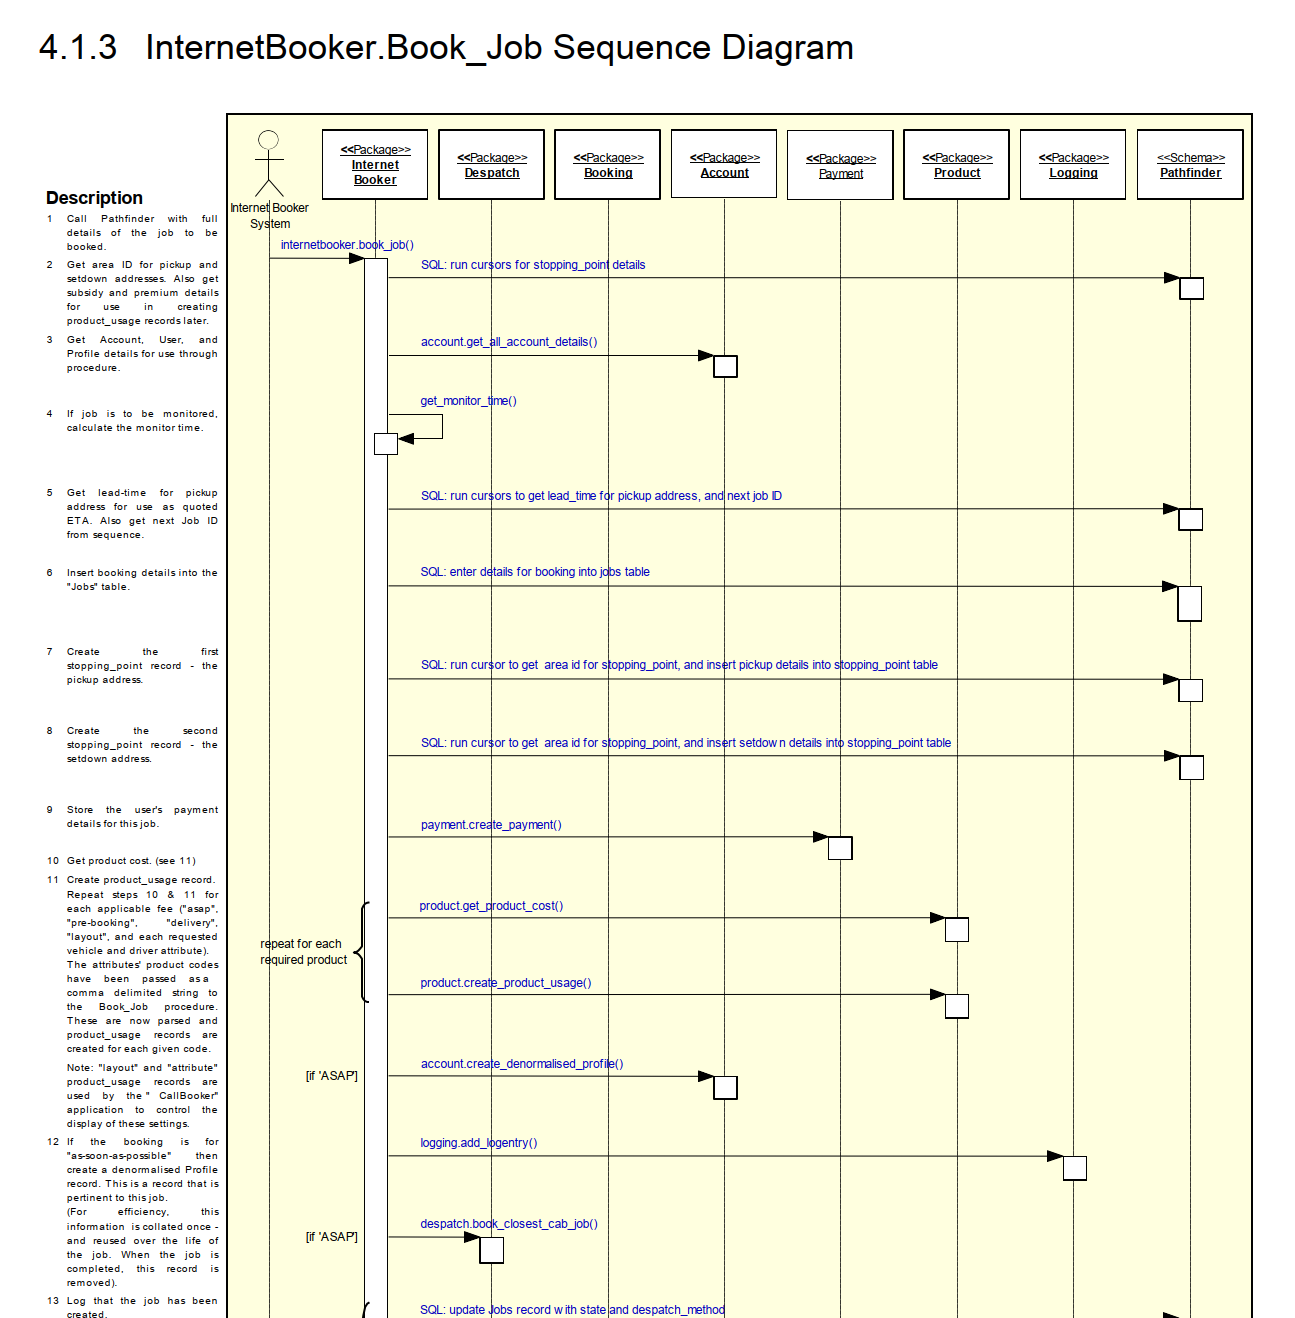
UML
A major digital initiative was stalled due to a vendor dispute. The only way through was to reverse engineer an API to a sophisticated real-time booking system…
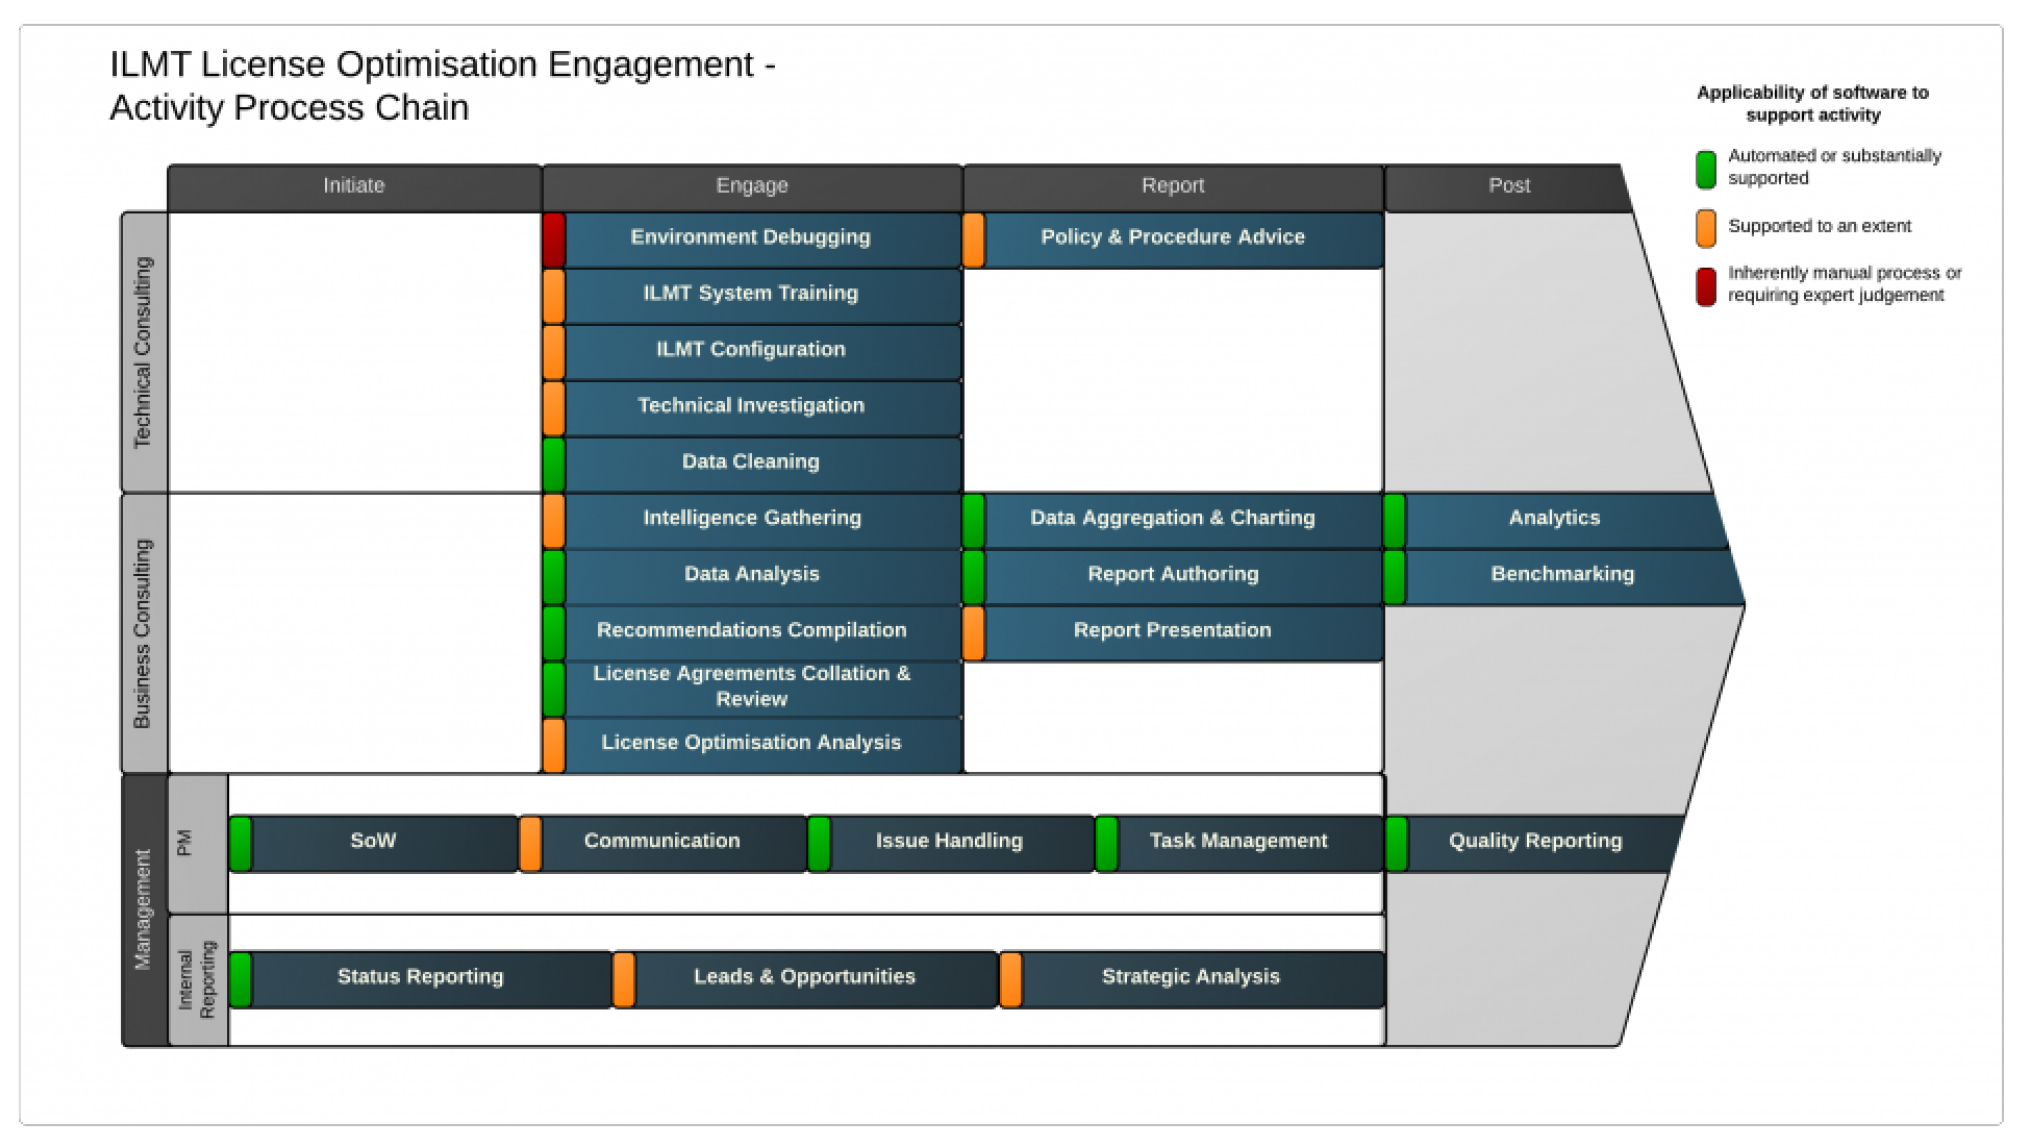
Value Chain Analysis
Here I’m using swimming-lanes and colour-coding inside Porter’s value-chain model to discuss the prioritisation of process-automation of a service offering I was designing.